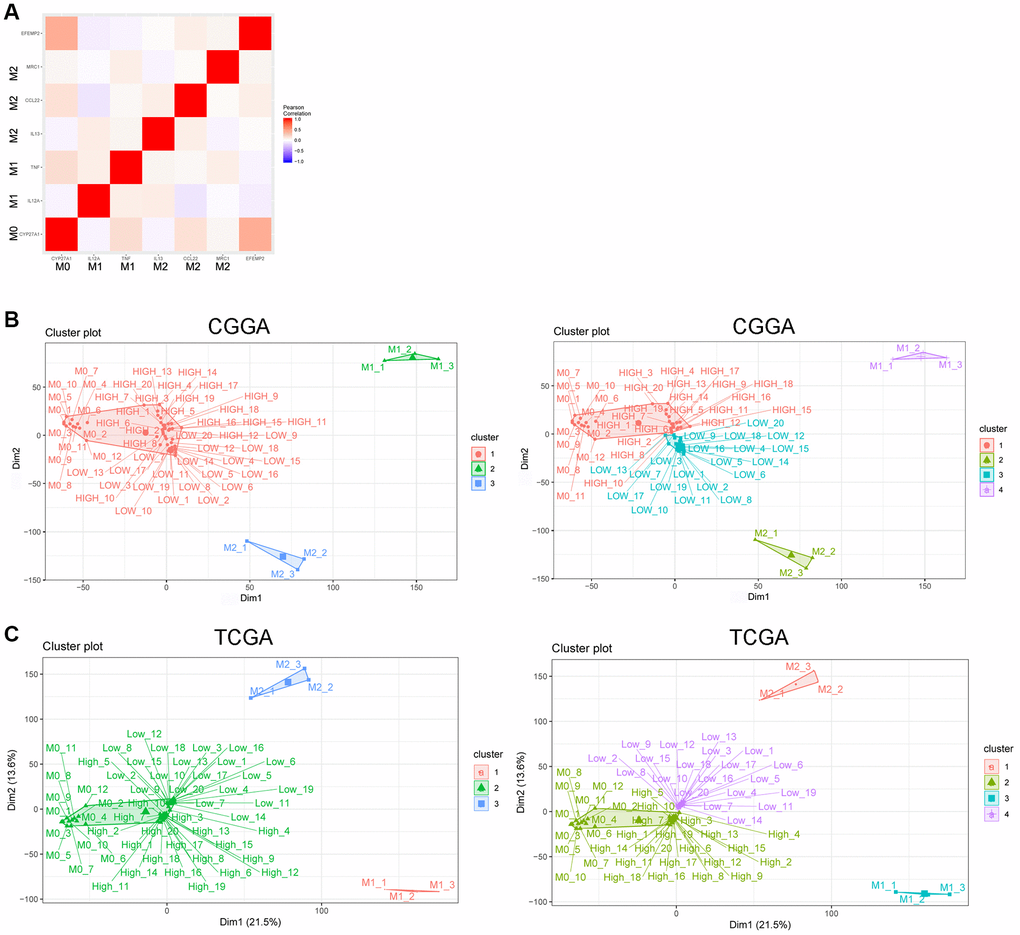
Figure 6.EFEMP2 indicates assembly of M0 macrophage. (A) Correlation analysis of EFEMP2 and representative molecular of M0 (CYP27A1), M1 (IL12A, TNF) and M2 (IL13, CCL22, and MRC1) phenotype. (B) K-Means clustering (cluster = 3 or 4) based on whole genome expression profiling of M0, M1 and M2 phenotype from the dataset of a variety of resting and activated human immune cells (GSE22886) and CGGA RNA sequencing data. The samples named as “HIGH” were the top 20 samples with highest expression of EFEMP2 in CGGA. The samples named as “LOW” were the top 20 samples with lowest expression of EFEMP2 in CGGA. (C) K-Means clustering (cluster = 3 or 4) based on whole genome expression profiling of M0, M1 and M2 phenotype from the dataset of a variety of resting and activated human immune cells (GSE22886) and TCGA RNA sequencing data. The samples named as “HIGH” were the top 20 samples with highest expression of EFEMP2 in TCGA. The samples named as “LOW” were the top 20 samples with lowest expression of EFEMP2 in TCGA.