Submit an Article
Navigate
Home
Editorial Board
Editorial Policies
Current Volume
Archive
Scientific Integrity
Publication Ethics Statements
Interviews with Outstanding Authors
Newsroom
Sponsored Conferences
Podcast
Contact
Special Collections
Submit an Article
Online ISSN: 1945-4589
Research Paper
|
Volume 12, Issue 9
|
pp. 8434–8458
Genetic regulatory subnetworks and key regulating genes in rat hippocampus perturbed by prenatal malnutrition: implications for major brain disorders
Back to article
Figure 4
(4 of 7)
−
100%
+
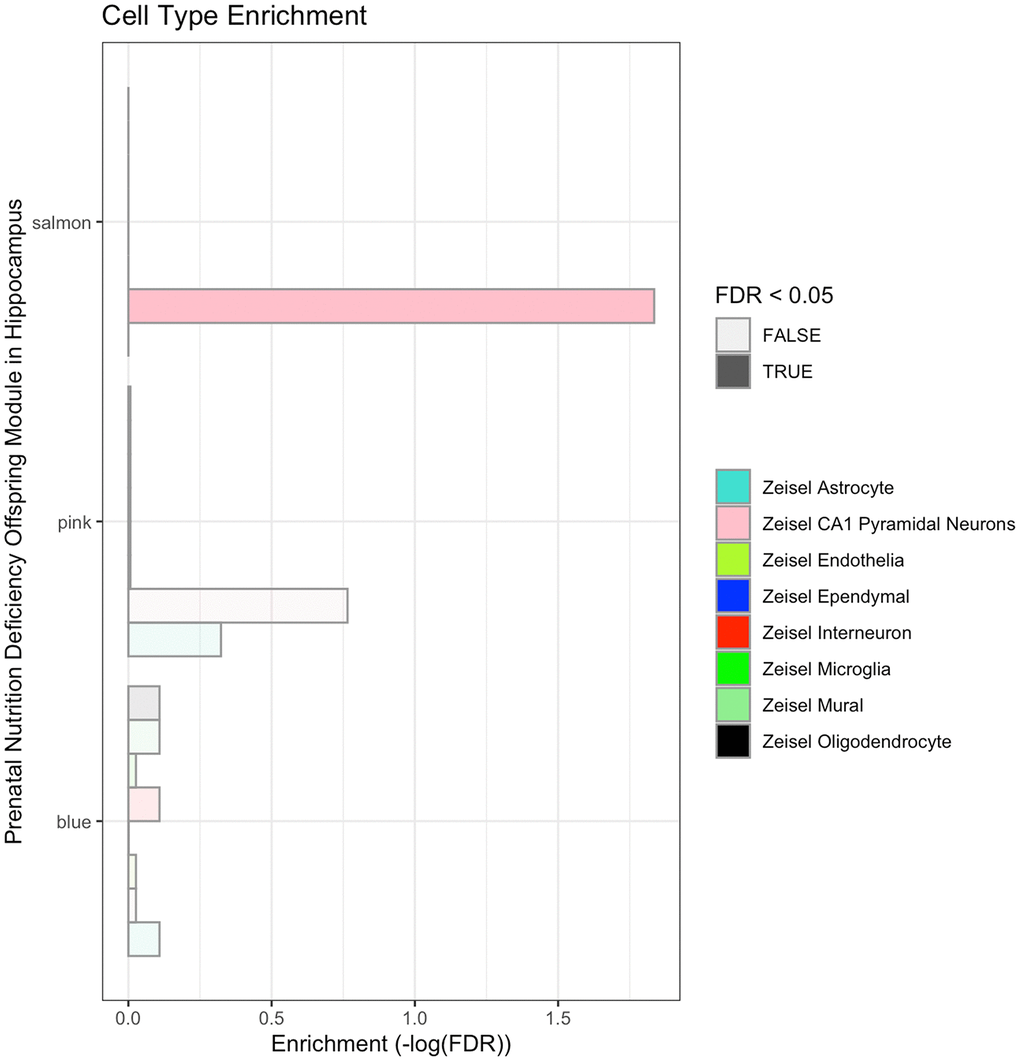
Figure 4.
Cell-type enrichment analysis of the blue, pink and salmon modules significantly responding to prenatal nutrition deficiency in the hippocampus.