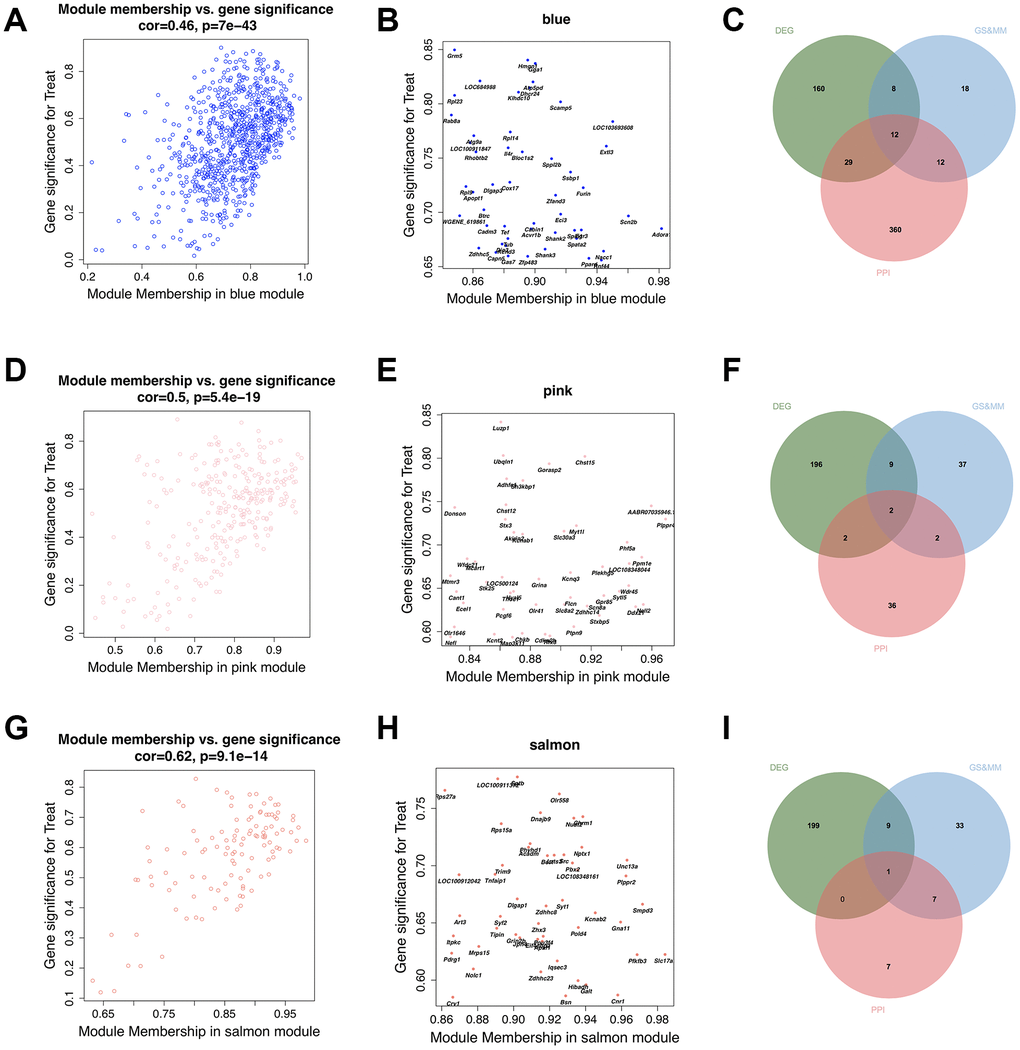
Figure 5.Identification of final hub genes from the hippocampus tissue. Scatter plotting of the correlation between gene significance (GS) and module membership (MM), top 50 module genes with high GS and MM, and Venn diagram of the overlapping genes belonging to the PPI network with degree ≥ 5, top 50 module genes with high GS and MM, and the differentially expressed genes (DEGs) in the blue (A–C), pink(D–F), and salmon (G–I) modules.