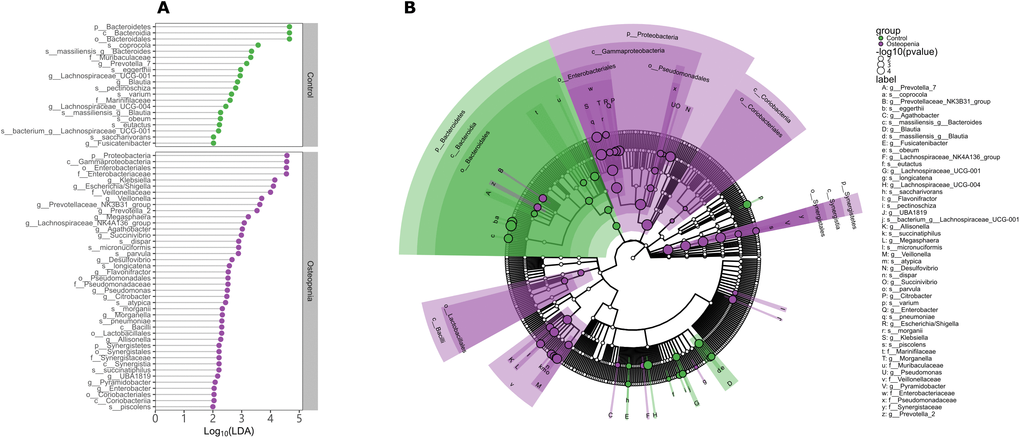
Figure 3.Discriminative taxa between postmenopausal osteopenia and control. (A) The point plot of LDA (Linear discriminant analysis) shows the features detected as statistically and biologically differential taxa between the different communities. (B) The taxonomic representation of statistically and biologically differences between postmenopausal osteopenia and control. The color of discriminative taxa represents the taxa is more abundant in the corresponding group (Control in green, postmenopausal osteopenia in purple). The size of point shows the negative logarithms (base 10) of p-value. The bigger size of point shows more significant (lower p-value).