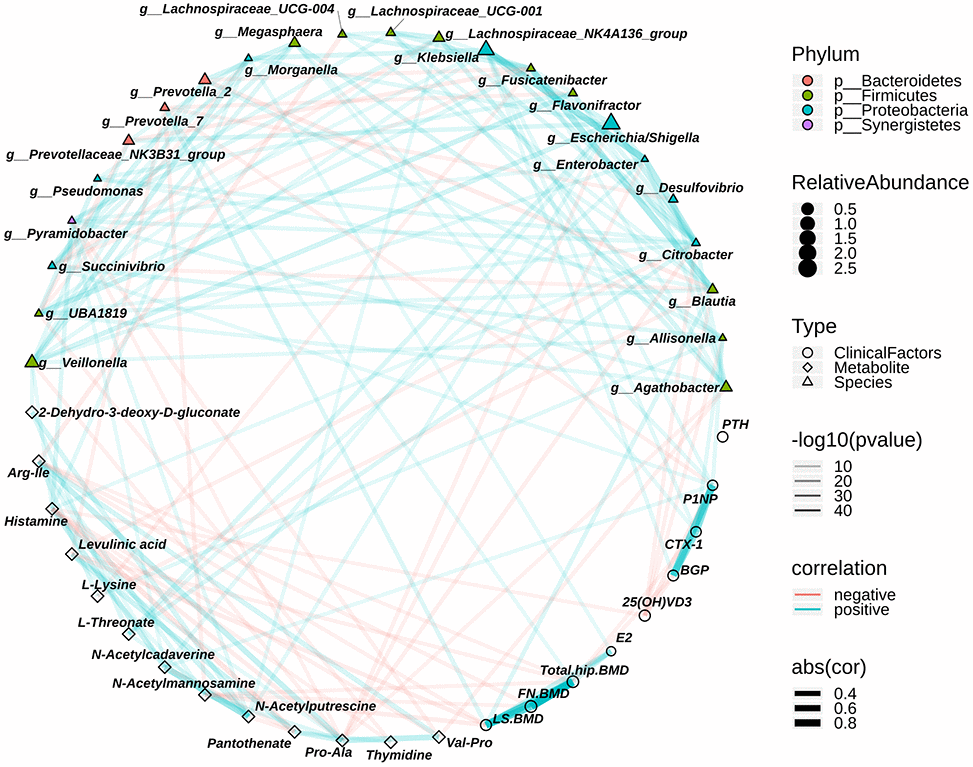
Figure 5.The relationship among the discriminative genera, discriminative fecal metabolites and the clinical index associated with osteoporosis. The colors of points show the different phyla of the genera. The size of points of genera shows the mean relative abundance. The circle points represent the clinical indexs, triangle points represent the discriminative genera, and diamond points represent the discriminative fecal metabolites. The transparency of lines represents the negative logarithms (base 10) of p-value of correlation (Spearman), the red lines represent the negative correlation and blue lines represent positive correlation, and the width of lines represents the size of correlation (Spearman).