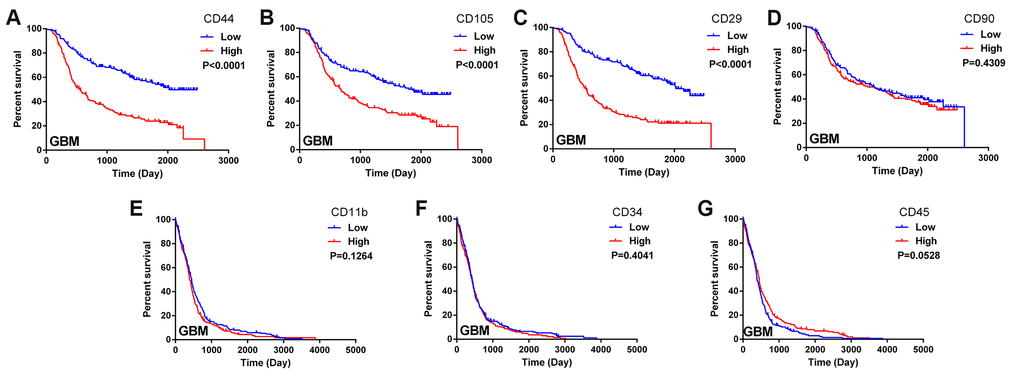
Figure 1.Biomarkers of MSCs in the glioma microenvironment. (A–D) Kaplan-Meier survival curves based on the expression of the MSC biomarkers CD44, CD105, CD29 and CD90 in glioblastoma tissues from the CGGA dataset; (E–G) Kaplan-Meier survival curves based on the expression of the MSC biomarkers CD11b, CD34 and CD45 in glioblastoma tissues from TCGA.