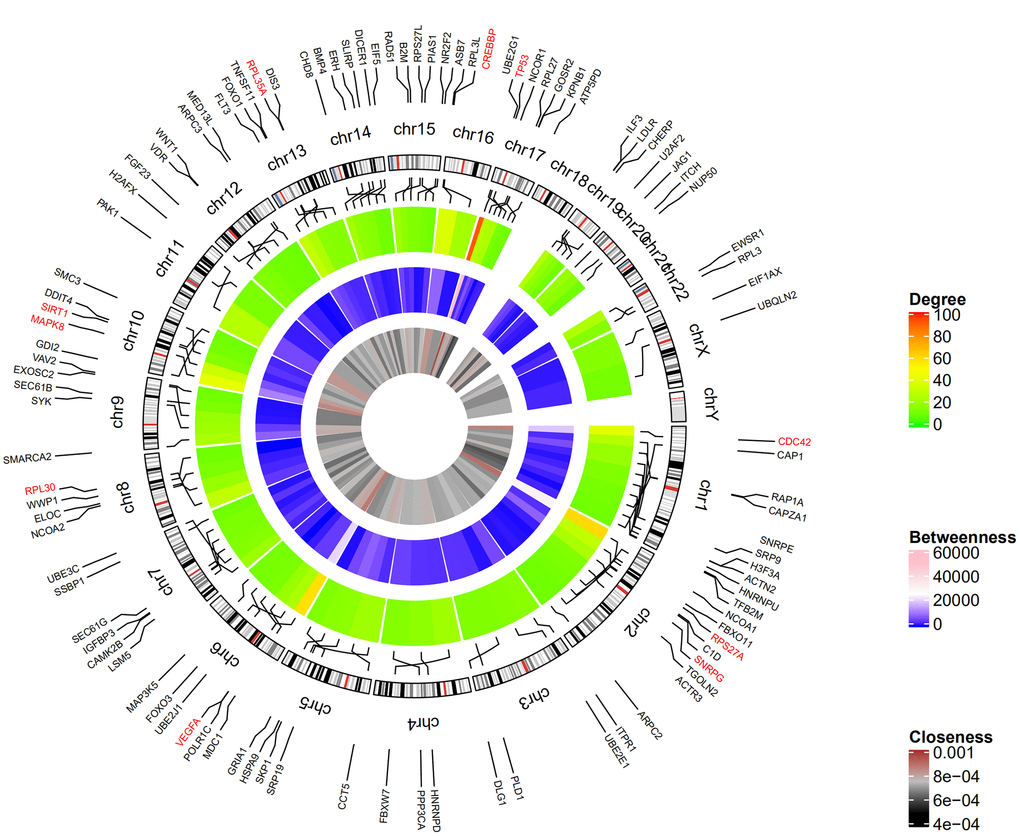
Figure 2.Circular visualization of chromosomal positions and connectivity of the top 100 genes. The circular map represents all the chromosomes and the lines from each gene point to their specific chromosomal locations. The names of the DEGs are shown in the outer circle and the three hub genes are shown in red. The red and green colors in the outer heatmap represent DEGs with high and low degree, respectively. The pink and blue colors in the middle heatmap represent DEGs with high and low betweenness, respectively. The brown and black colors in the inner most heatmap represent DEGs with high and low closeness, respectively.