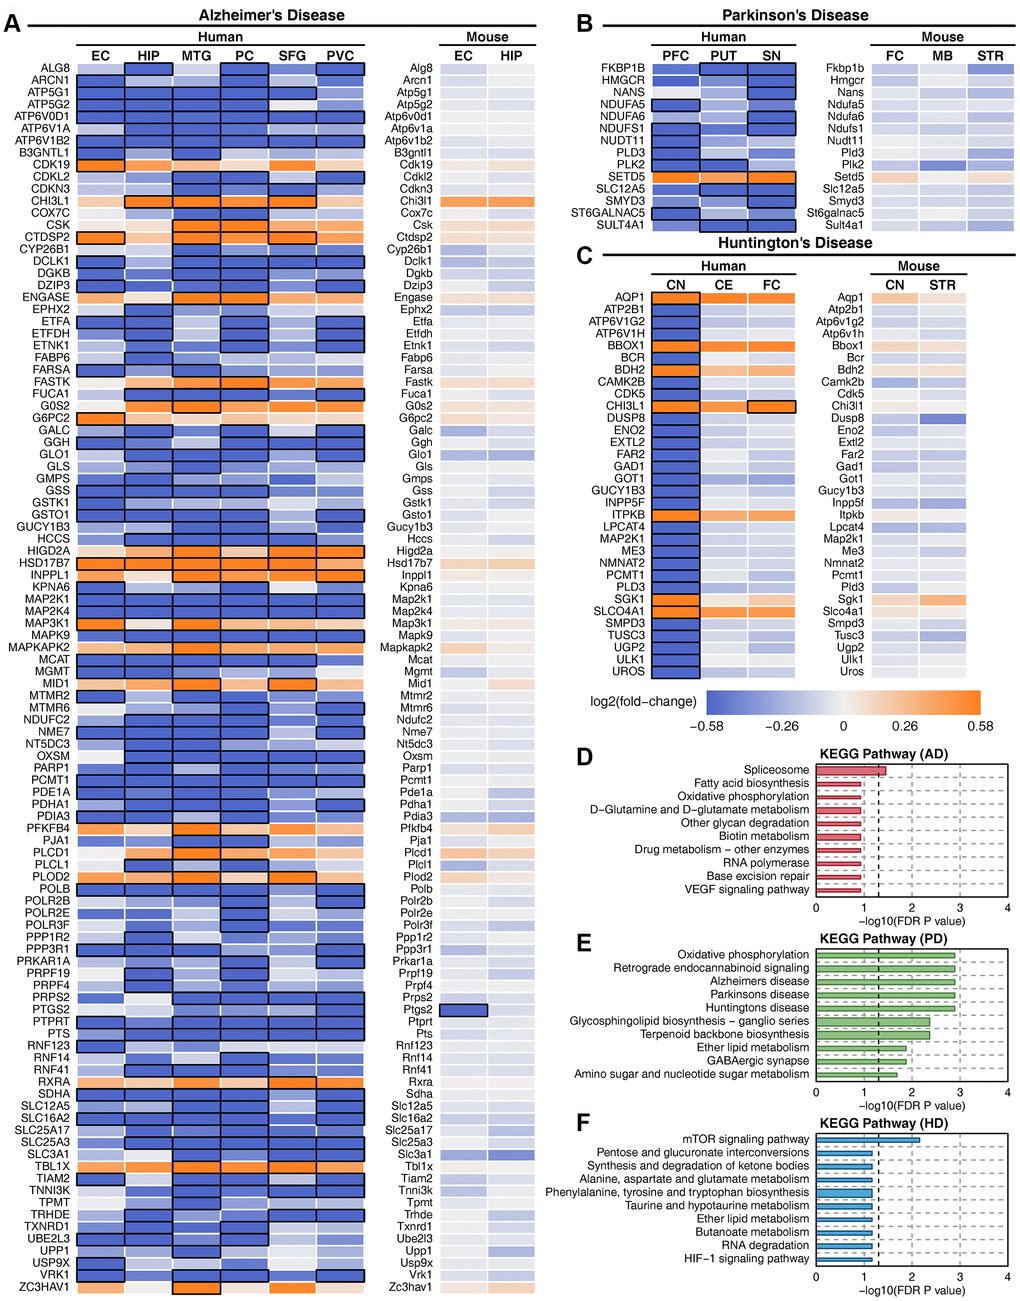
Figure 6.Deregulated metabolic genes with consistent expression between human patients and mouse models. (A) Heatmap of consistently expressed deregulated genes in AD human samples and the APP transgenic mouse model. (B) Heatmap of consistently expressed deregulated genes in PD human samples and the MPTP mouse model. (C) Heatmap of consistently expressed deregulated genes in HD human samples and the Hdh CAG knock-in mouse model. The orange color indicates that the gene is upregulated, the blue color indicates that the gene is downregulated, and black squares indicate statistical significance. (D) Enriched metabolic pathway of consistently expressed deregulated genes in AD. (E) Enriched metabolic pathway of consistently expressed deregulated genes in PD. (F) Enriched metabolic pathway of consistently expressed deregulated genes in HD.