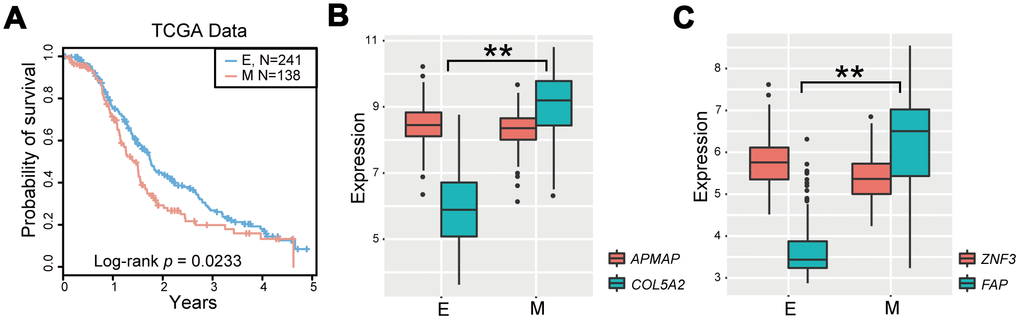
Figure 2.Identification of the EMT signature for OvCa. (A) Kaplan-Meier survival curves according to OvCa epithelial status and mesenchymal status in TCGA cases treated with platinum-based therapies. (B, C) Boxplot of expression levels of two gene pairs (APMAP and COL5A2, and ZNF3 and FAP). *P < 0.05, **P < 0.01 in Wilcoxon rank-sum test. E, epithelial status; M, mesenchymal status.