Submit an Article
Navigate
Home
Editorial Board
Editorial Policies
Current Volume
Archive
Scientific Integrity
Publication Ethics Statements
Interviews with Outstanding Authors
Newsroom
Sponsored Conferences
Podcast
Contact
Special Collections
Submit an Article
Online ISSN: 1945-4589
Research Paper
|
Volume 12, Issue 15
|
pp. 15314–15327
Anabolic-androgenic steroids and brain injury: miRNA evaluation in users compared to cocaine abusers and elderly people
Back to article
Figure 5
(5 of 6)
−
100%
+
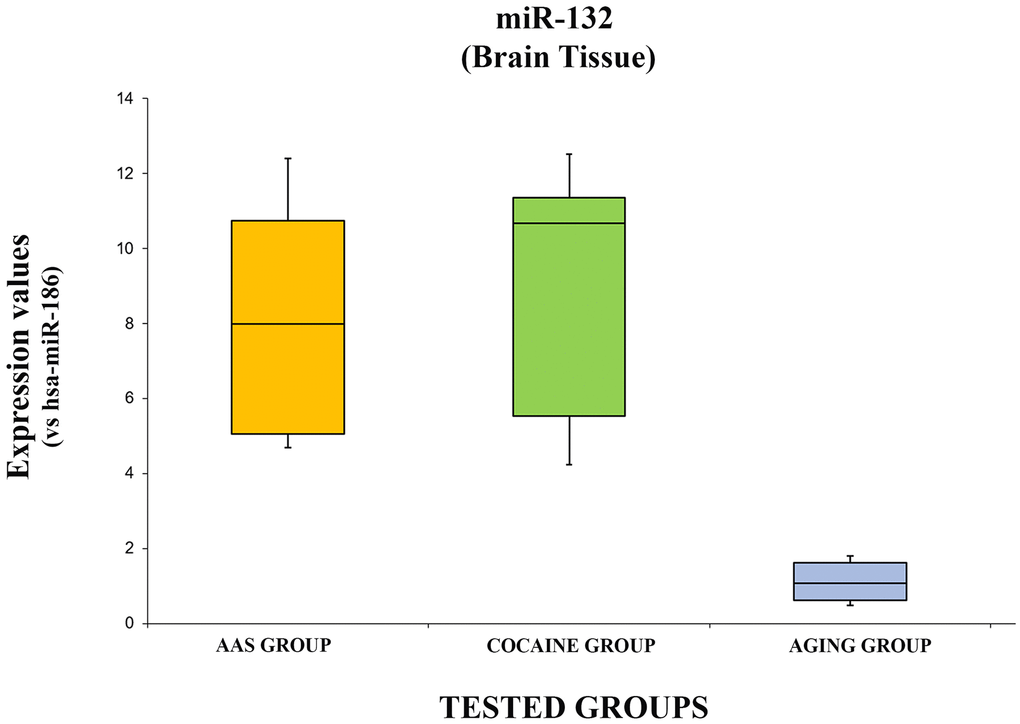
Figure 5.
In this figure, the box plot analyses compare the expression levels of hsa-miR-132-3p (endogenous control miR-186) in each group.
Figure 5 — Anabolic-androgenic steroids and brain injury: miRNA evaluation in users compared to cocaine abusers and elderly people | Aging