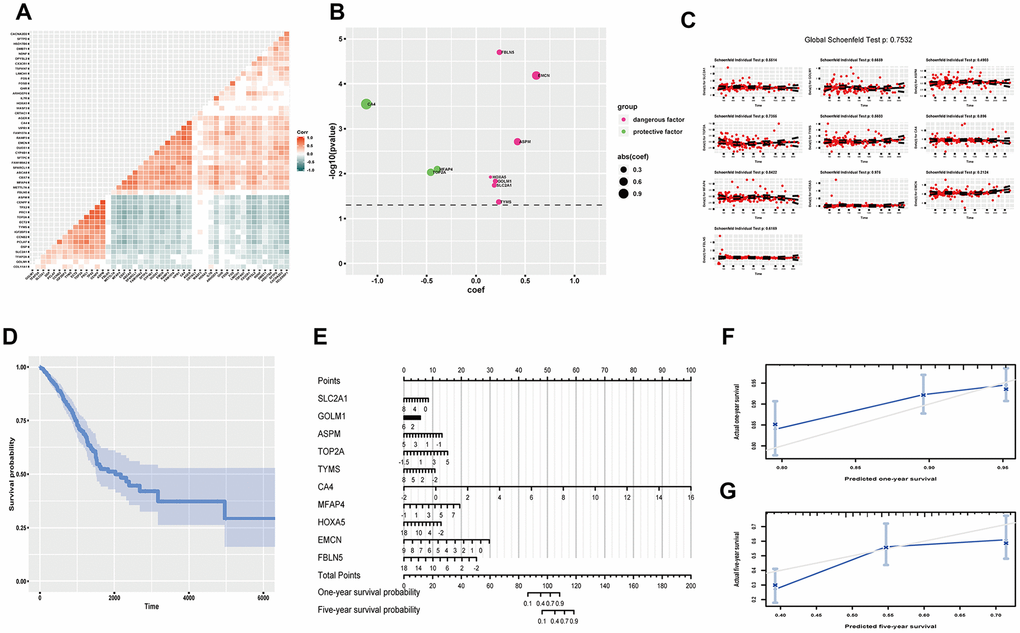
Figure 4.Predicting OS probability of LUAD. (A) Heatmap to exhibit correlation of genes; (B) coef and p value of genes in the optimized Cox proportional hazards regression model; (C) Residual plots to test proportional hazard assumption; (D) K-M curve exhibiting cumulative OS probability based on mean covariables; (E) Nomograph for predicting one-year and five-year OS probability; (F) Examining predicting efficacy of one year OS probability; (G) Examining predicting efficacy of five year OS probability. Corr, correlation coefficient; OS, overall survival; DEGs, differentially expressed genes; coef, coefficient; K-M, Kaplan-Meier.