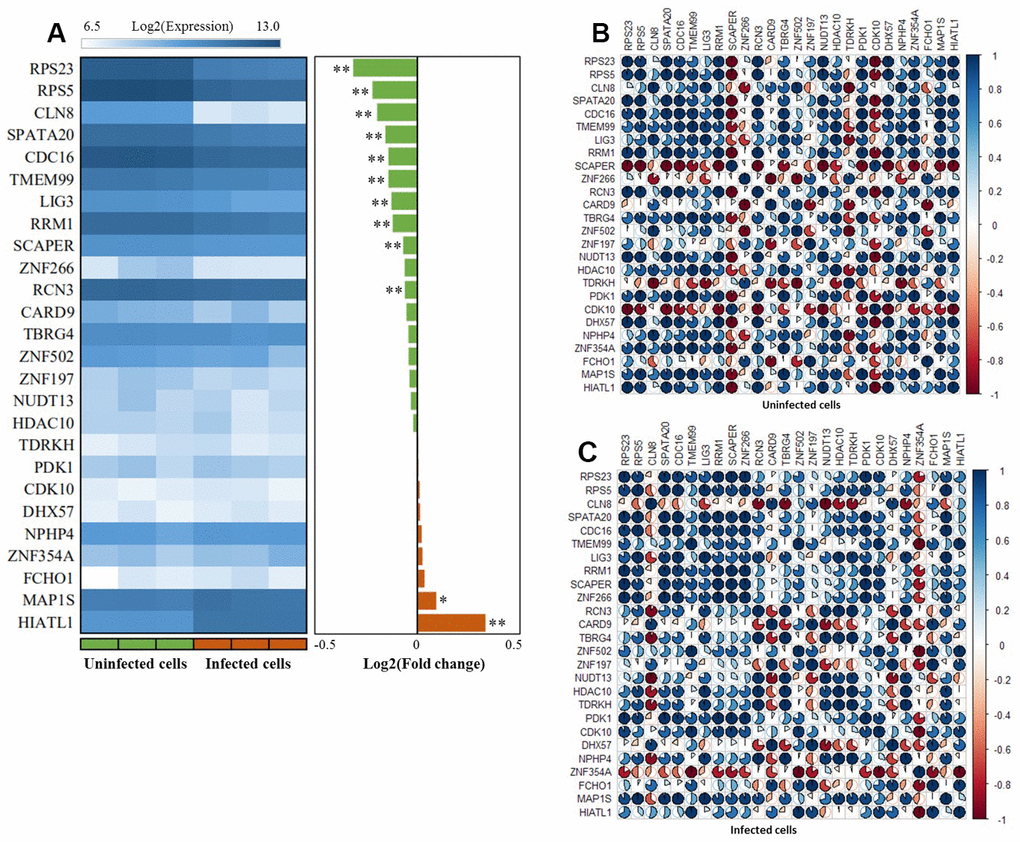
Figure 6.The expression patterns of these 26 risk genes between infected cells and uninfected cells based on the GSE133803 dataset. (A) Heatmap showing the expression levels of 26 risk genes between infected cells and uninfected cells; * represents the t-test P value < 0.05, ** represents the t-test P value < 0.01; (B) The co-expression patterns of 26 risk genes based on the Pearson correlation analysis in uninfected cells; (C) The co-expression patterns of 26 risk genes based on the Pearson correlation analysis in infected cells.