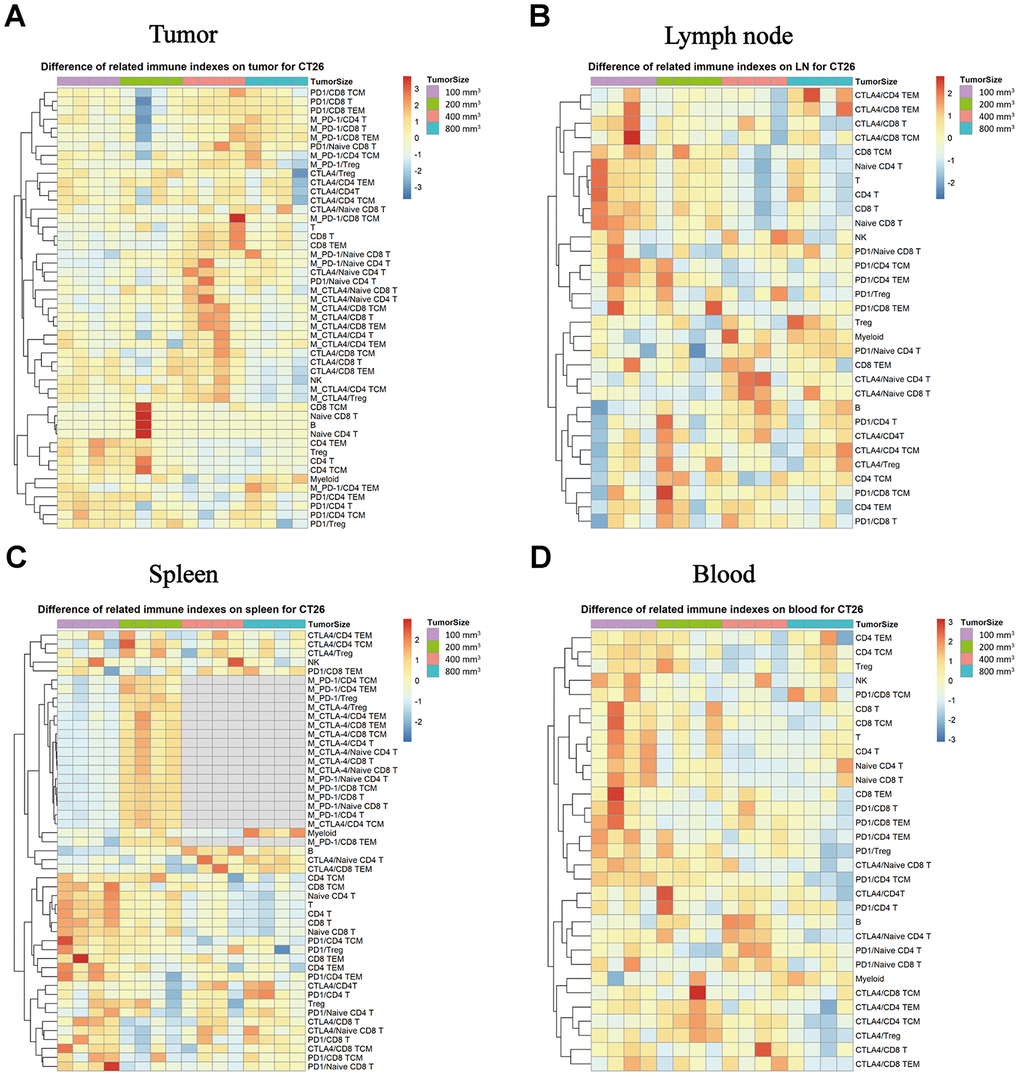
Figure 5.Expression of PD-1 and CTLA-4 checkpoints in each subpopulation of different immune tissues at different stages of the tumor progression. The different colors represent the different levels of expression. The differential expression of PD-1 and CTLA-4 in immune cell subpopulations in different immune tissues isolated from the CT26 animal model in Balb/c female mice. (A) Different expression levels of PD-1 and CTLA-4 in each subpopulation in TILs. (B) Different expression levels of PD-1 and CTLA-4 in each subpopulation in the lymph nodes. (C) Different expression levels of PD-1 and CTLA-4 in each subpopulation in the spleen (no sufficient data could be gathered for the MFI of CTLA-4 in the different subpopulations when the tumor size was 400 mm3 and 800 mm3). (D) Different expression levels of PD-1 and CTLA-4 in each subpopulation in the peripheral blood samples in the CT26 animal model. The statistical analysis in this figure was obtained by analyzing the raw data. The dendrogram was plotted from the raw data of each subpopulation and biomarker using the R language.