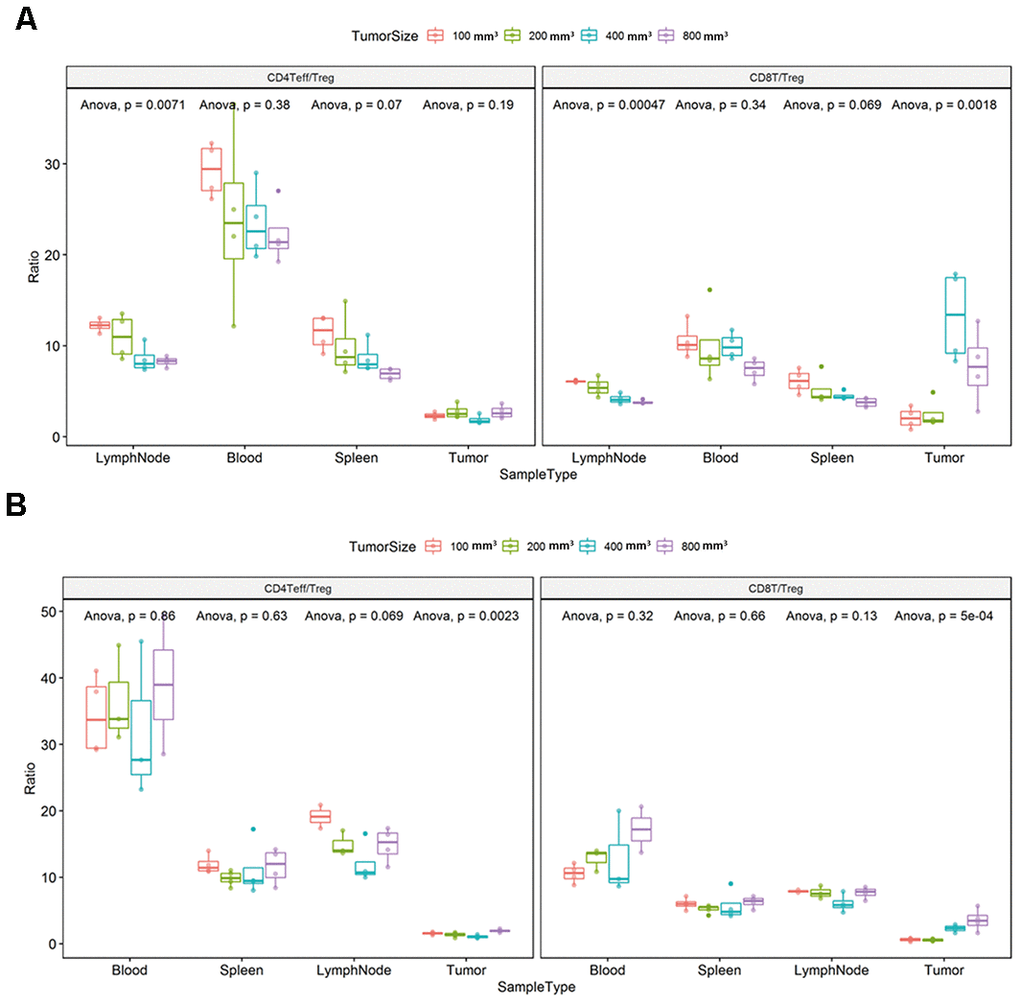
Figure 7.Ratio of CD4+ Effector T / regulatory T cells (Teff/Treg) and CD8+ T/Treg (T/regulatory T cells) in each immune tissue. The error bar represents the variation of the data in the same group. The different colors represent the different tumor sizes in the corresponding tissues. (A) Differential ratio of Teff/Treg in CD4T and CD8T/Treg in the difference tumor progression phase in the CT26 animal model. (B) Differential ratio of Teff/Treg in CD4T and CD8T/Treg in the difference tumor progression phase in the Colon26 animal model. The statistical analysis in this figure was obtained by analyzing the raw data.