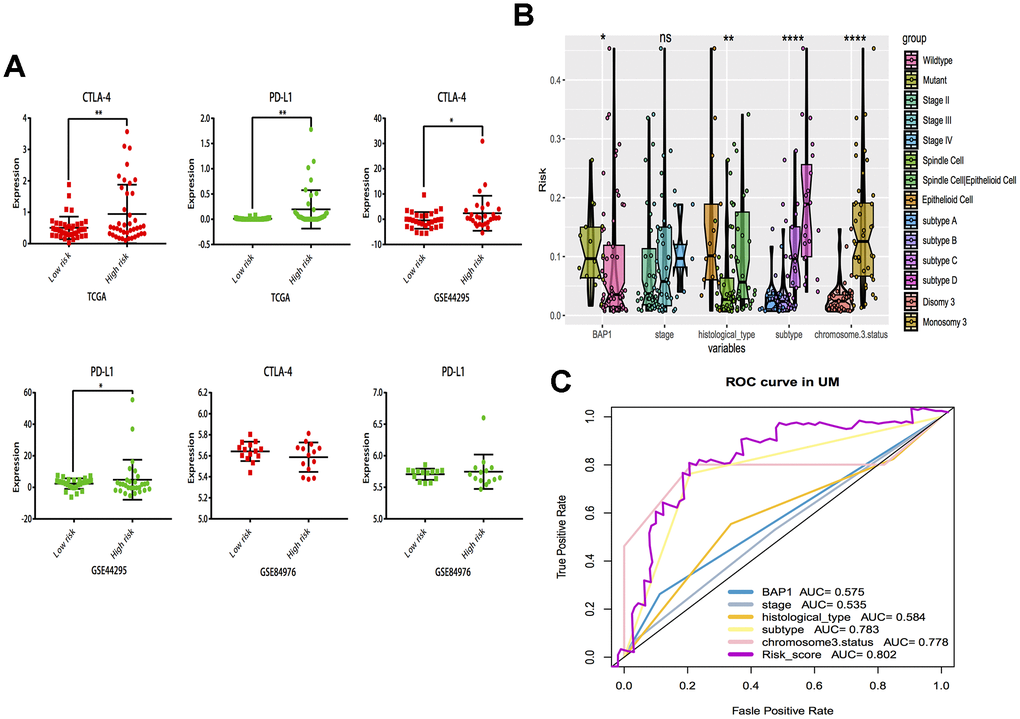
Figure 7.Subgroup analysis and risk score distribution. (A) Box-plot analysis of high and low groups in CTLA-4 and PD-L1 expression. (B) The association between risk score distribution and established prognostic markers, including BAP1 mutant, tumor stage, histological type, chromosome 3 status, and molecular subtype. (C) The 3 years area under the curve (AUC) of risk score and prognostic markers (BAP1 mutant, tumor stage, histological type, chromosome 3 status and molecular subtype) associated with OS in TCGA. *P < 0.05, ** P < 0.01,***P < 0.001,****P < 0.0001.