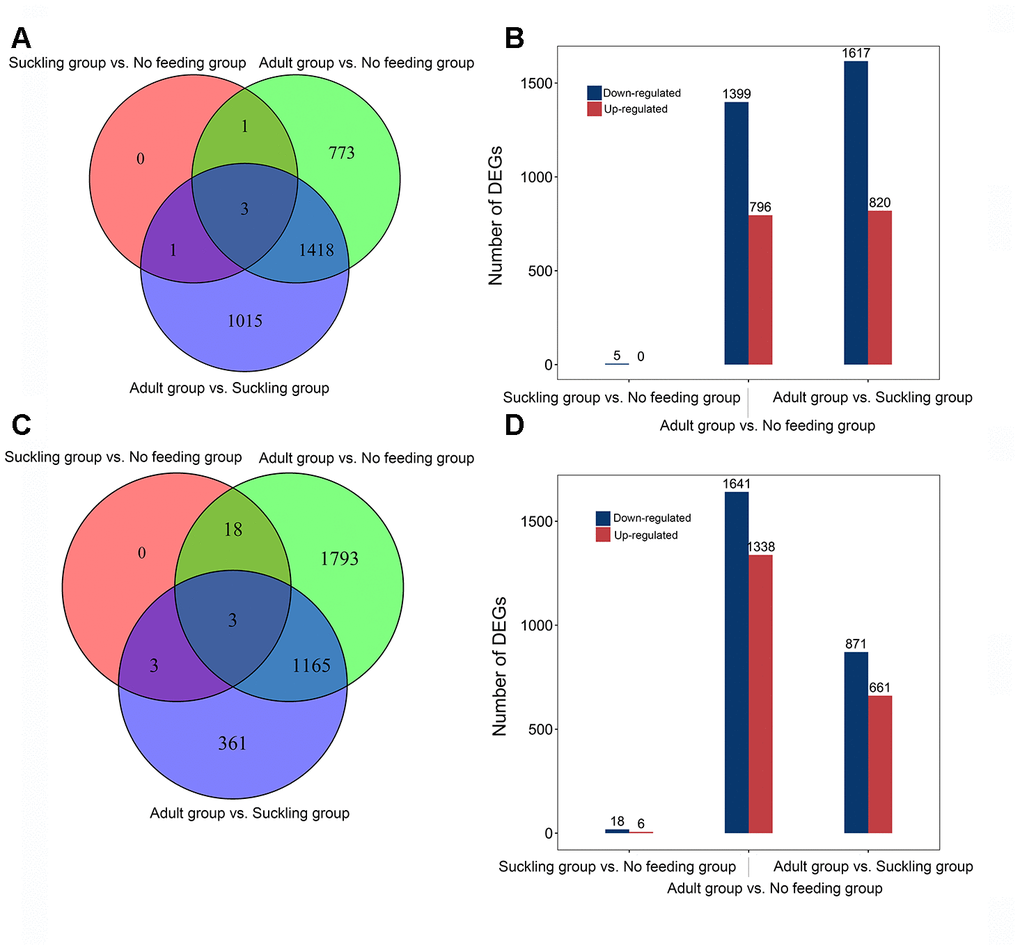
Figure 2.Distribution of differentially expressed genes of giant panda liver and pancreas at different postnatal stages. (A) Venn diagram indicating DEGs that are shared between different comparisons in the liver. (B) The number of up-and down-regulated DEGs in different comparisons in the liver. (C) Venn diagram indicating DEGs that are shared between different comparisons in the pancreas. (D) The number of up-and down-regulated DEGs in different comparisons in the pancreas.