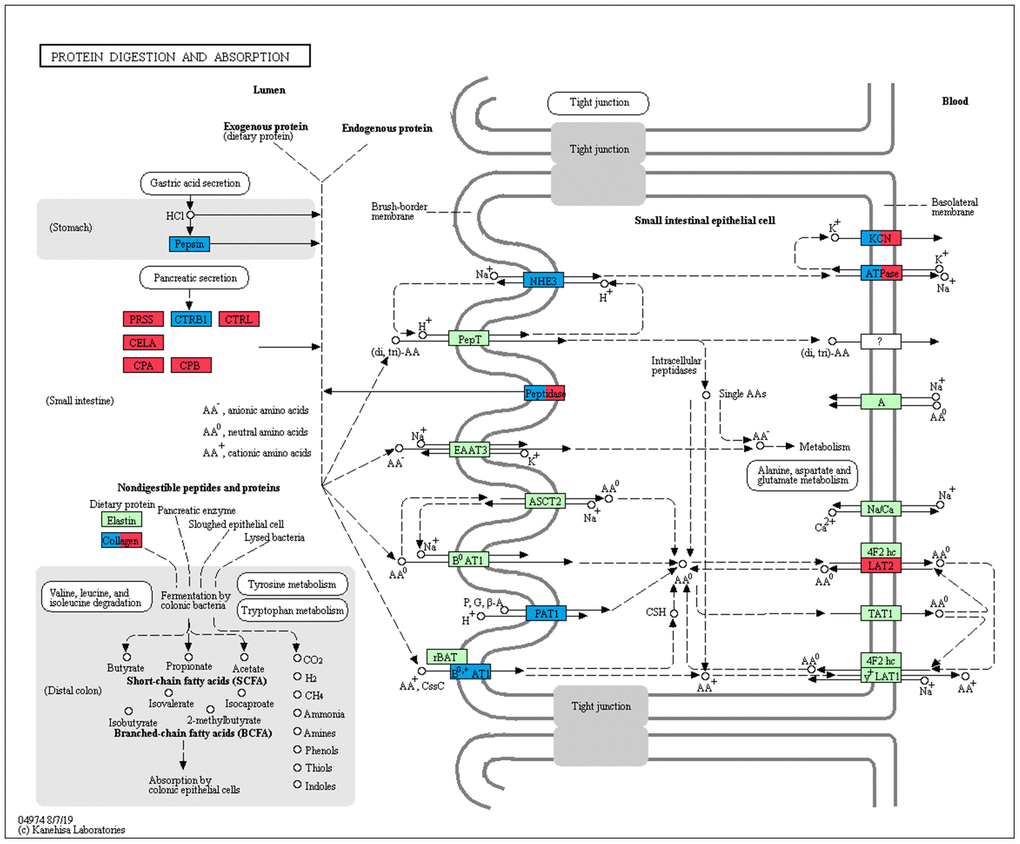
Figure 5.Expression trend of DEGs involved in protein digestion and absorption pathway in the pancreas. Red: genes that were continuously increased and had the highest expression in adult group during development; Blue: genes that were continuously decreased and had the lowest expression in adult group during development; Green: genes were not differentially expressed during development.