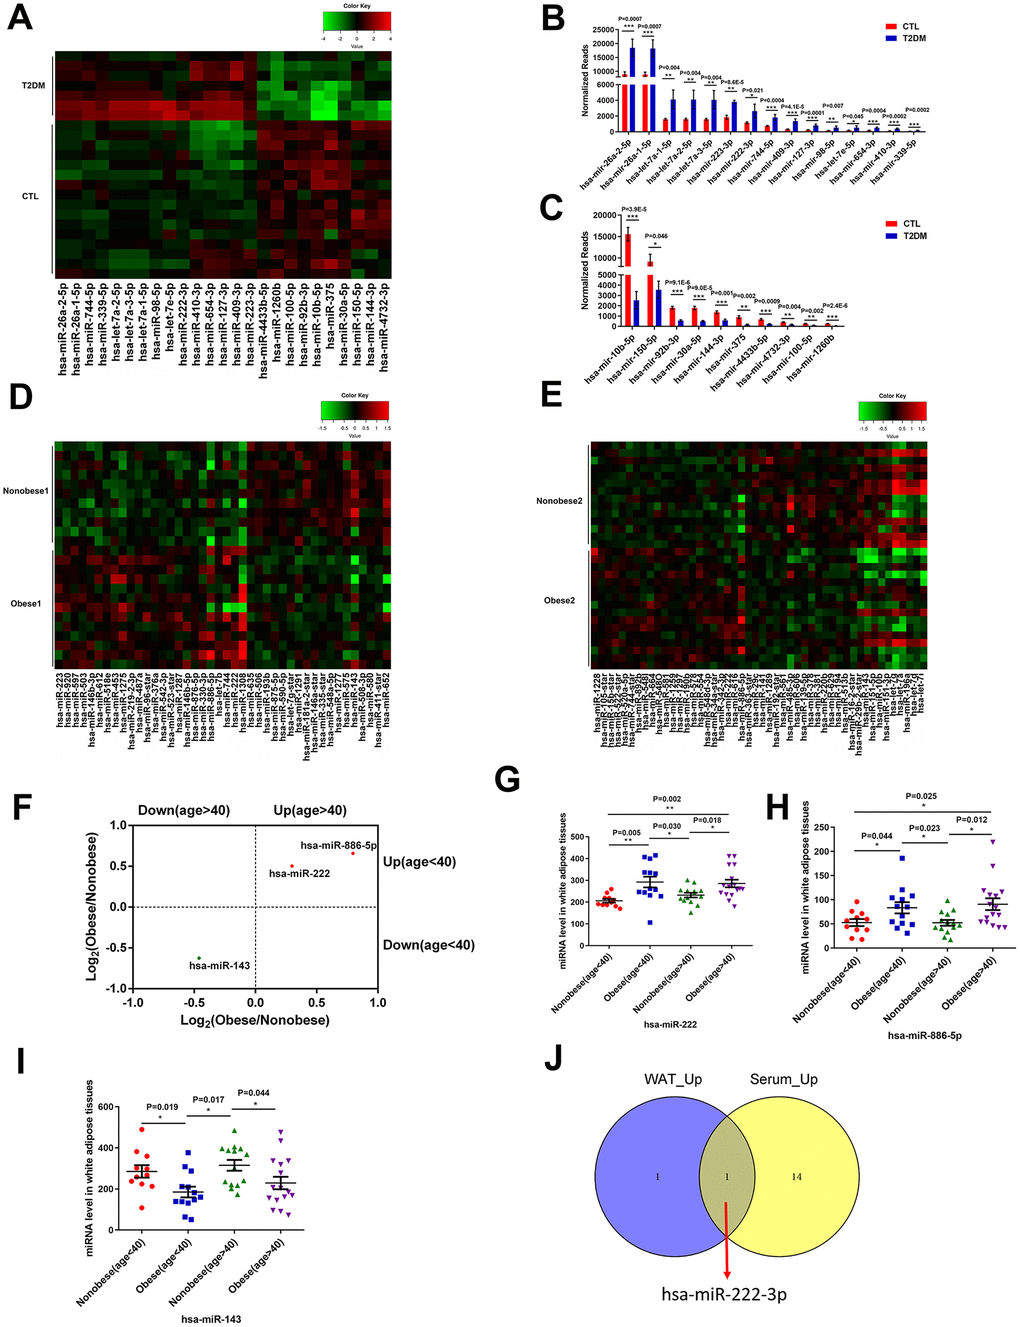
Figure 1.MiR-222 expression is significantly increased in the serum of T2DM patients and the white adipose tissues of obese insulin-resistant patients. (A) Heat map shows the differential expression of 25 miRNAs in the serum samples from T2DM patients (T2DM, n=7) and healthy subjects (CTL, n=16) using P < 0.05, FC (T2DM/CTL) > 2 or < 0.5, and at least 100 reads in all samples as the cut-off criteria. The color-coded key denotes the fold-changes. (B, C) The bar graphs show the normalized reads of the 15 upregulated and the 10 downregulated miRNAs in the serum of T2DM patients compared to the serum of healthy subjects. (D) The heat map shows the differential expression of 42 miRNAs in the WAT samples from the young non-obese group (Non-obese 1; n=11) and the young obese group (Obese 1; n=13) using P < 0.05 as the selection criterion. The color-coded key denotes the fold changes. (E) The heat map shows the differential expression of 49 miRNAs in the WAT samples from the old non-obese group (Non-obese 2; n=14) and the old obese group (Obese 2; n=16) using P < 0.05 as the selection criterion. The color-coded key denotes the fold changes. (F) The scatter plot shows the 3 miRNAs, miR-222, miR-143, and miR-886-5p that are differentially regulated consistently in the old and young obese individuals compared to the corresponding non-obese individuals. (G–I) The dot plots show the levels of (G) miR-222, (H) miR-886-5p, and (I) miR-143 in the WAT samples from the young non-obese, young obese, old non-obese, and old obese groups. (J) The Venn diagram shows that miR-222 is the only miRNA that is upregulated in both the T2DM patient serum (15 upregulated miRNAs) and obese (young and old) WAT (2 upregulated miRNAs) samples. Note: The results in (A–C) are based on the GSE90028 dataset. The results in (D–I) are based on the GSE25402 dataset. Note: T2DM, type 2 diabetes mellitus; WAT, white adipose tissue; Data are presented as the means ± SE; *P < 0.05, **P < 0.01, ***P < 0.001.