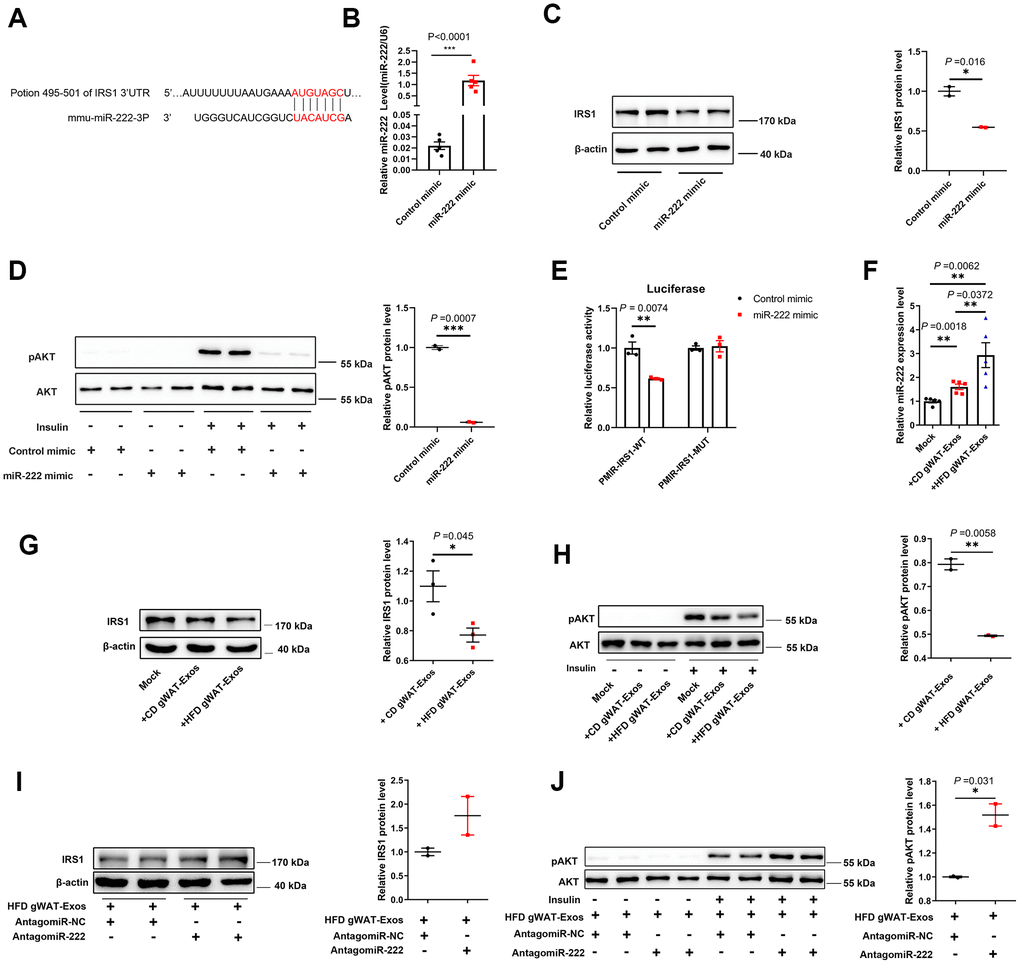
Figure 5.Exosomal miR-222 secreted by gWAT inhibits the sensitivity of the insulin signal pathway by repressing IRS1. (A) Representative diagram shows the results of TargetScan (http://www.targetscan.org/vert_72/) analysis predicting the presence of the miR-222 target site in the 3'-UTR of IRS-1. (B) QRT-PCR analysis shows the relative expression of miR-222 in the miR-NC- and miR-222 mimic-transfected Hepa 1-6 cells for 48 h (n=5 per group). (C) Western blot analysis shows IRS1 protein levels in the Hepa 1-6 cells transfected with miR-NC- and miR-222 mimic for 48 h. β-actin was used as loading control. (D) Western blot analysis shows phospho-AKT and AKT protein levels in the Hepa 1-6 cells transfected with miR-NC- and miR-222 mimic for 48 h and further treated with (+) or without (-)100 nM insulin for 10 min. The phospho-AKT levels were normalized to the total AKT levels. (E) Luciferase reporter activity assay results show the normalized luciferase activity in the HEK-293T cells co-transfected with miR-NC or miR-222 mimic plus pMIR-IRS1-WT plasmid or pMIR-IRS1-MUT plasmid (n=3 per group). (F) QRT-PCR analysis shows the relative expression of miR-222 in the Hepa 1-6 cells co-cultured with CD-gWAT-Exos or HFD-gWAT-Exos for 48h (n=5 per group). (G) Western blot analysis shows IRS1 protein levels in the Hepa 1-6 cells co-cultured with CD-gWAT-Exos or HFD-gWAT-Exos relative to the mock control at 48h. β-actin was used as loading control. The analysis is based on Figure 5G and Supplementary Figure 7A, 7B. (H) Western blot analysis shows phospho-AKT and AKT levels in the Hepa 1-6 cells co-cultured with CD-gWAT-Exos or HFD-gWAT-Exos relative to the mock control at 48h. The phospho-AKT levels were normalized to the total AKT levels. The analysis is based on Figure 5H and Supplementary Figure 7C. (I) Western blot analysis shows IRS1 protein levels in the antagomiR-NC- and antagomiR-222-transfected Hepa 1-6 cells co-cultured with HFD-gWAT-Exos for 48 h. β-actin was used as loading control. (J) Western blot analysis shows phospho-AKT and AKT levels in the antagomiR-NC- and antagomiR-222-transfected Hepa 1-6 cells co-cultured with HFD-gWAT-Exos for 48 h. The phospho-AKT levels were normalized to the total AKT levels. Note: CD-gWAT-Exos: exosomes secreted by the gWAT of CD mice; HFD-gWAT-Exos: exosomes secreted by the gWAT of HFD mice; The data are presented as the means ± SE; * P < 0.05, ** P < 0.01, *** P < 0.001.