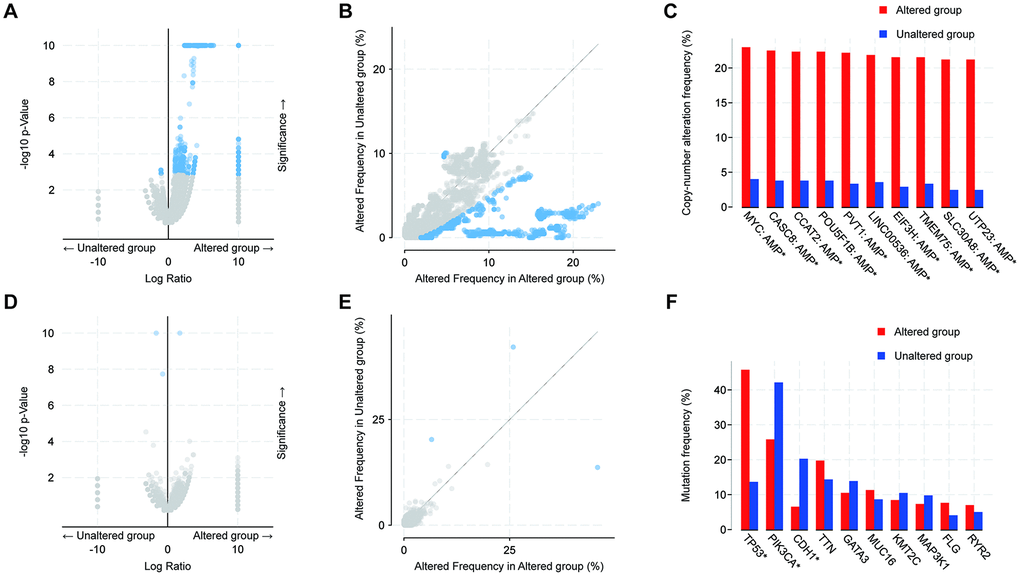
Figure 8.Analysis of global genes associated with mutations in 14-3-3. (A, B) Scatter and volcano plots exhibiting genes associated with alterations in 14-3-3 CNA frequency. (C) Box blot representing the 10 most frequently altered genes. Amp: amplification. (D, E) Scatter and volcano plots exhibiting genes associated with mutations altered frequency in 14-3-3. (F) Box blot representing the 10 most frequently altered genes; only 3 genes exhibited significant differences.