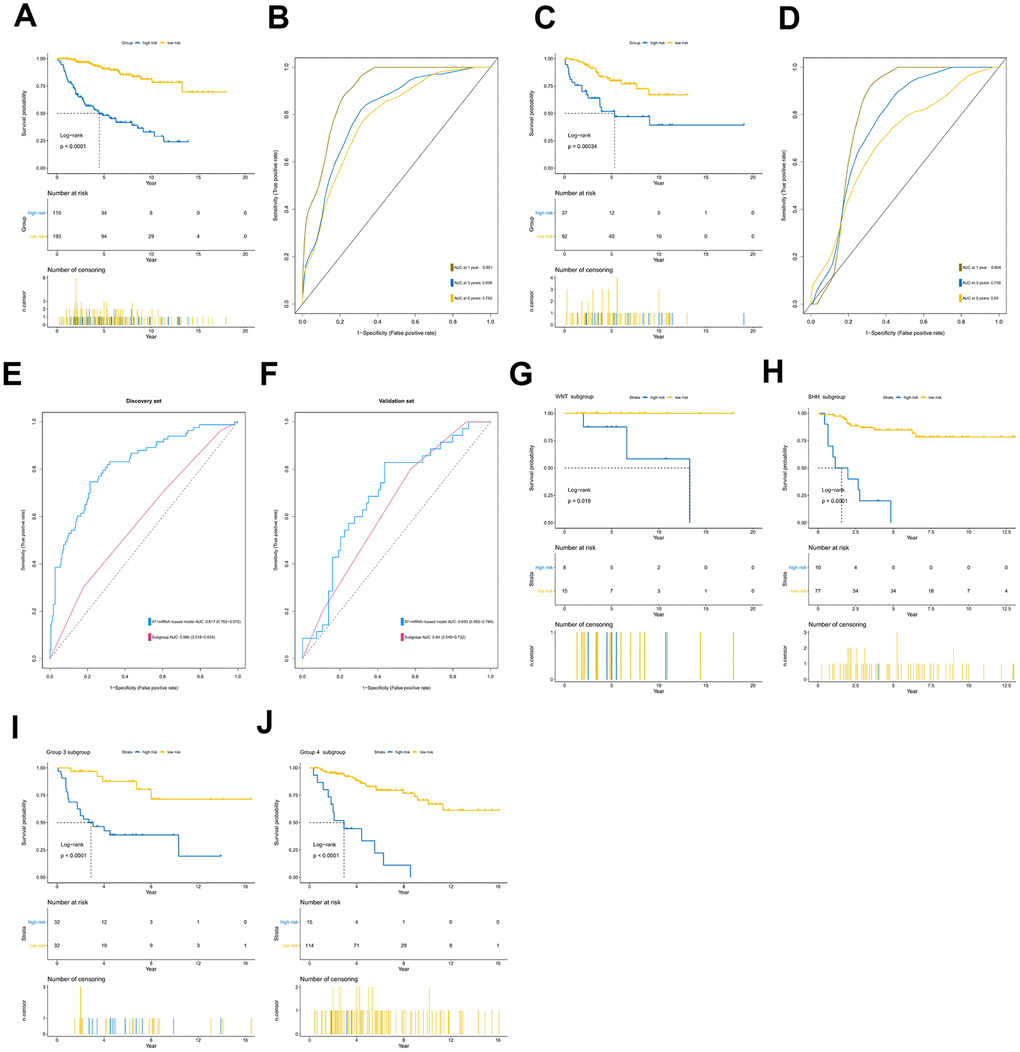
Figure 3.Prognostic value of the 47-mRNA metastasis-related model. The Kaplan-Meier (K-M) curves show the OS of the high- and low-risk patients with MB classified by the optimal cutoff value. (A) K-M curves for the discovery set. (B) ROC curves for the 47-mRNA-based model in the discovery set. (C) K-M curves for the validation set. (D) ROC curves for the 47-mRNA-based model in the validation set. (E) The comparison of the area under the ROC of the 47-mRNA-based model versus that of subgroup in the discovery set. (F) The comparison of the area under the ROC of the 47-mRNA-based model versus that of subgroup in the validation set. (G) K-M curves showing the OS for the high- and low-risk patients with WNT MB using the 47-mRNA-based model in the discovery set. (H) K-M curves showing the OS for the high- and low-risk patients with SHH MB using the 47-mRNA-based model in the discovery set. (I) K-M curves showing the OS for the high- and low-risk patients with group 3 MB using the 47-mRNA-based model in the discovery set. (J) K-M curves showing the OS for the high- and low-risk patients with group 4 MB using the 47-mRNA-based model in the discovery set.