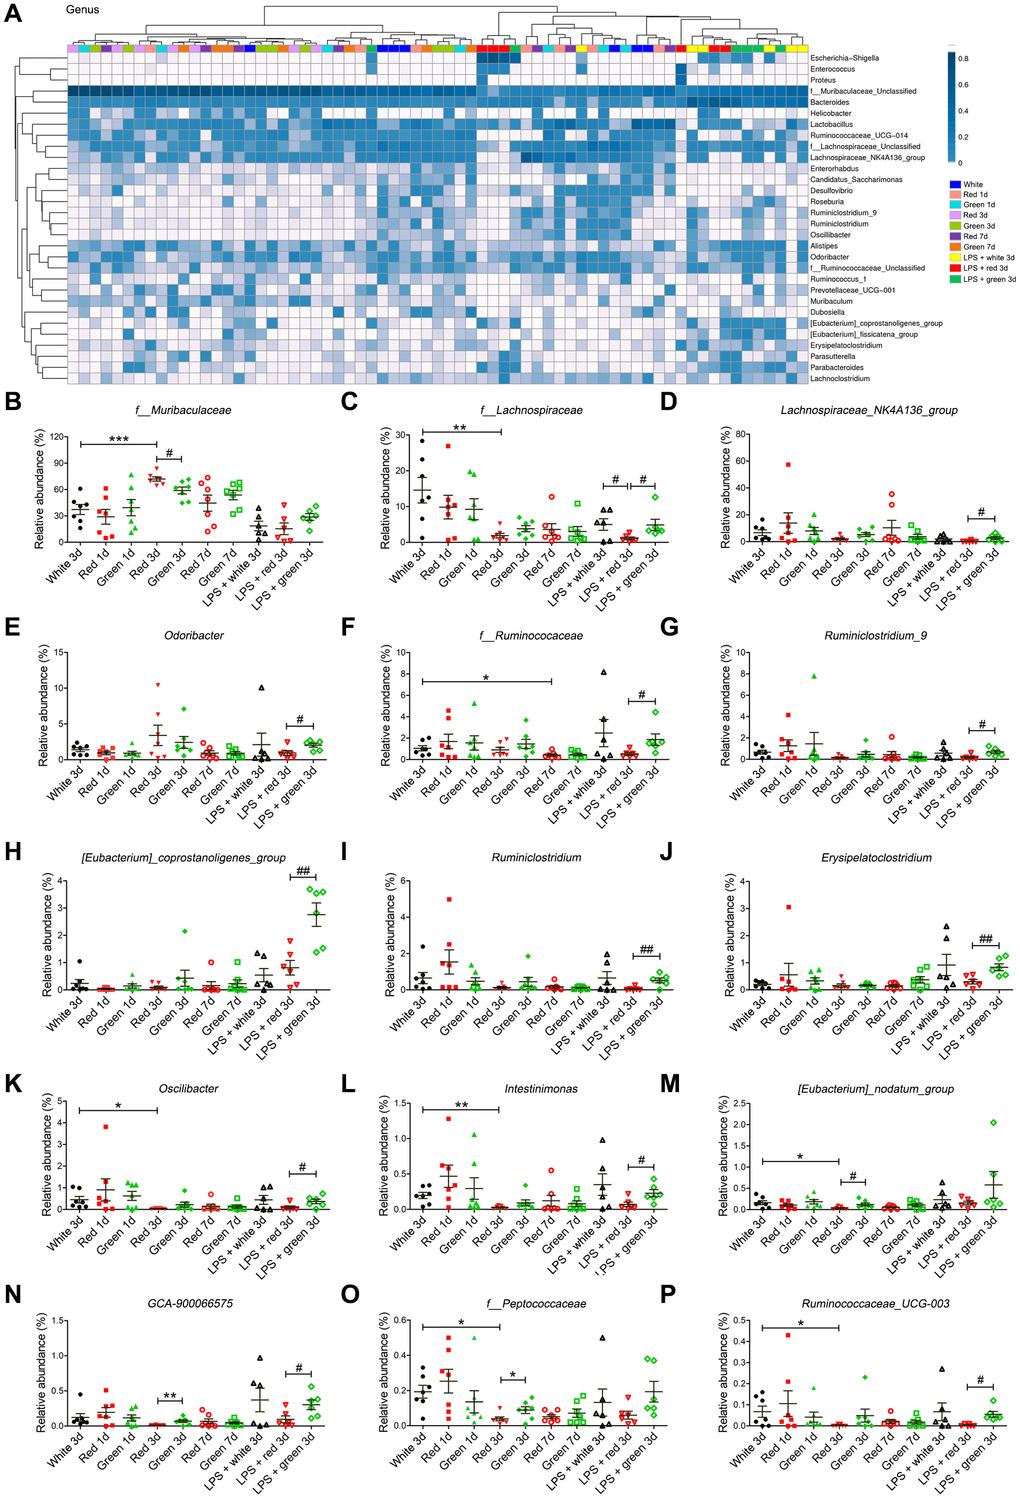
Figure 6.Altered gut bacterial composition at the genus level. (A) Relative abundance at the genus level in the different groups. (B) Red light exposure increased the abundance of f_Muribaculaceae in non-LPS-treated mice on day 3 relative to ambient white light or green light exposure. (C) Red light-exposed non-septic and septic mice had a lower abundance of f_Lachnospiraceae than ambient white light-exposed mice on day 3. (D) Red light exposure reduced the abundance of Lachnospiraceae_NK4A136_group in septic mice relative to green light exposure. (E) Red light exposure reduced the abundance of Odoribacter in septic mice relative to green light exposure. (F) Red light exposure reduced the abundance of f_Ruminococcaceae on day 3 relative to green light exposure in septic mice. Red light exposure reduced the abundances of Ruminiclostridium_9 (G), [Eubacterium]_coprostanoligenes_group (H), Ruminiclostridium (I) and Erysipelatoclostridium (J) in septic mice relative to green light exposure. Red light exposure reduced the abundances of Oscillibacter (K) and Intestinimonas (L) in non-septic mice on day 3 relative to ambient white light exposure, as well as in septic mice on day 3 relative to green light exposure. (M) Red light exposure reduced the abundance of [Eubacterium]_nodatum_group in non-LPS-treated mice on day 3 relative to ambient white light or green light exposure. (N) Red light exposure reduced the abundance of GCA-900066575 in both non-septic and septic mice on day 3 relative to green light exposure. (O) Red light exposure reduced the abundance of f_Peptococcaceae in non-septic mice on day 3 relative to ambient white light or green light exposure. (P) Red light exposure reduced the abundance of Ruminococcaceae_UCG-003 in non-septic mice on day 3 relative to ambient white light exposure, as well as in septic mice on day 3 relative to green light exposure. Data are shown as the mean ± SEM (n = 6-7/group). *P < 0.05, **P < 0.01, ***P < 0.001, #P < 0.05, ##P < 0.01, ###P < 0.001.