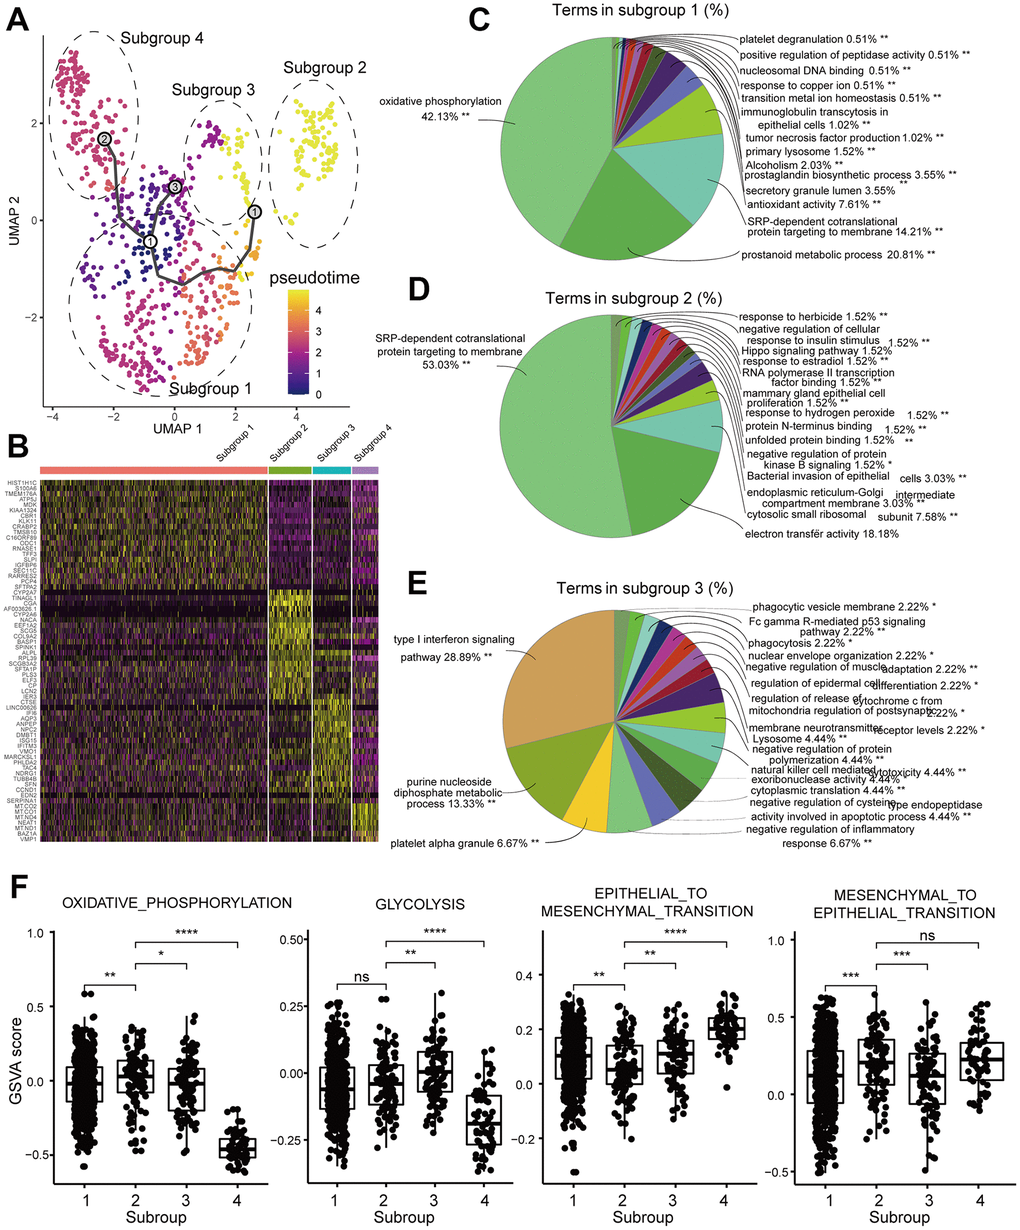
Figure 5.Functional enrichment analyses of the DEGs in the tumor cell subgroups of the brain metastasis sample, GSM3516671. (A) UMAP plot shows the different trajectories of the four tumor cell subgroups in GSM3516671. (B) Heatmap shows the differentially expressed genes (DEGs) in the four tumor cell subgroups of the brain metastasis sample, GSM3516671. (C–E) Pie graphs show the enrichment analysis for the three tumor cell subgroups of the brain metastasis sample, GSM3516671 (DEGs in the subgroup 4 were not sufficient for enrichment analysis). (F) Gene set variation analysis (GSVA) of the 4 tumor cell subgroups in the brain metastasis sample, GSM3516671.