Submit an Article
Navigate
Home
Editorial Board
Editorial Policies
Current Volume
Archive
Scientific Integrity
Publication Ethics Statements
Interviews with Outstanding Authors
Newsroom
Sponsored Conferences
Podcast
Contact
Special Collections
Submit an Article
Online ISSN: 1945-4589
Research Paper
|
Volume 12, Issue 21
|
pp. 21582–21596
Autophagy-related long noncoding RNAs can predict prognosis in patients with bladder cancer
Back to article
Figure 5
(5 of 9)
−
100%
+
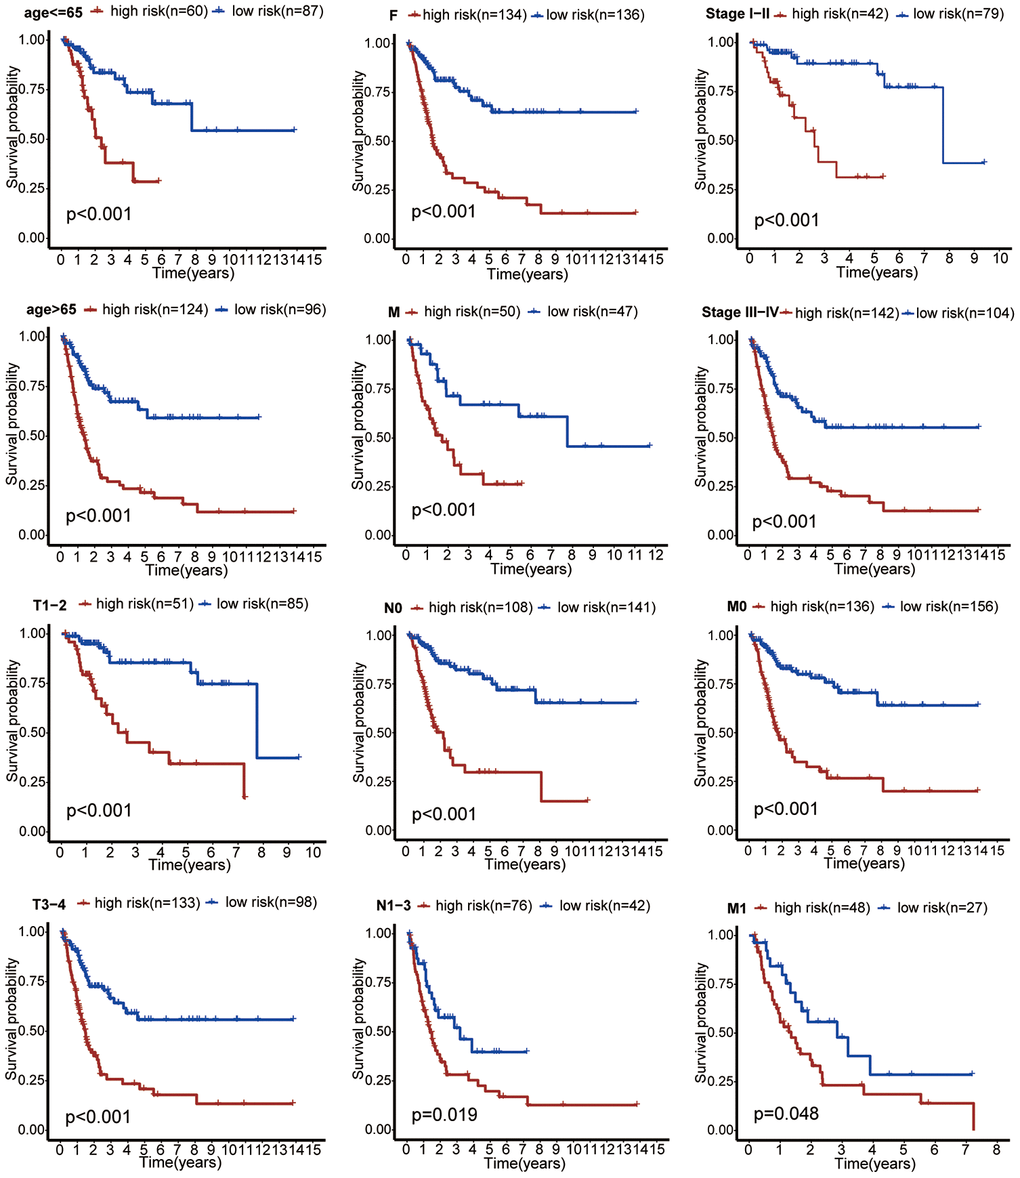
Figure 5.
Subgroup analysis showed that patients in the high-risk group had worse OS than that in the low-risk group in subgroups based on age, gender, clinical stage, and TNM stage.