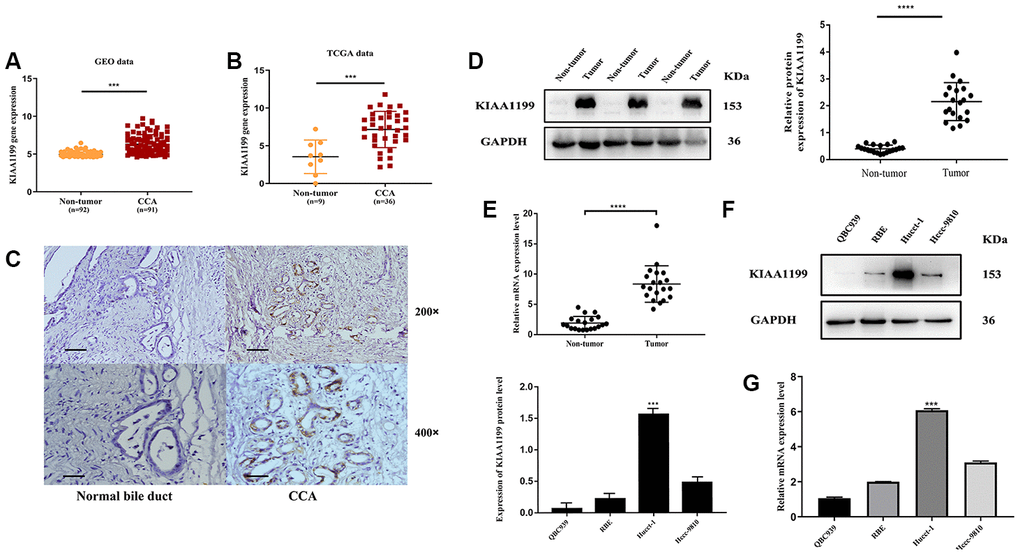
Figure 1.Bioinformatics prediction. (A) GEO: (GSE76297), Normal: n=92, CCA: n=91, (p<0.001). (B) TCGA database, Normal: n=9, CCA: n=36, (p<0.001). Protein and mRNA expression of KIAA1199 in CCA tissues and CCA cell lines: (C) The relative expression levels of KIAA1199 in Pathological sections. (D) The relative protein expression levels of KIAA1199 in 20 pairs of CCA and adjacent normal tissues(p<0.001). (E) The relative mRNA expression levels of KIAA1199 in 20 pairs of CCA and adjacent normal tissues(p<0.001). (F, G) The relative protein and mRNA expression of KIAA1199 in four CCA cell lines.