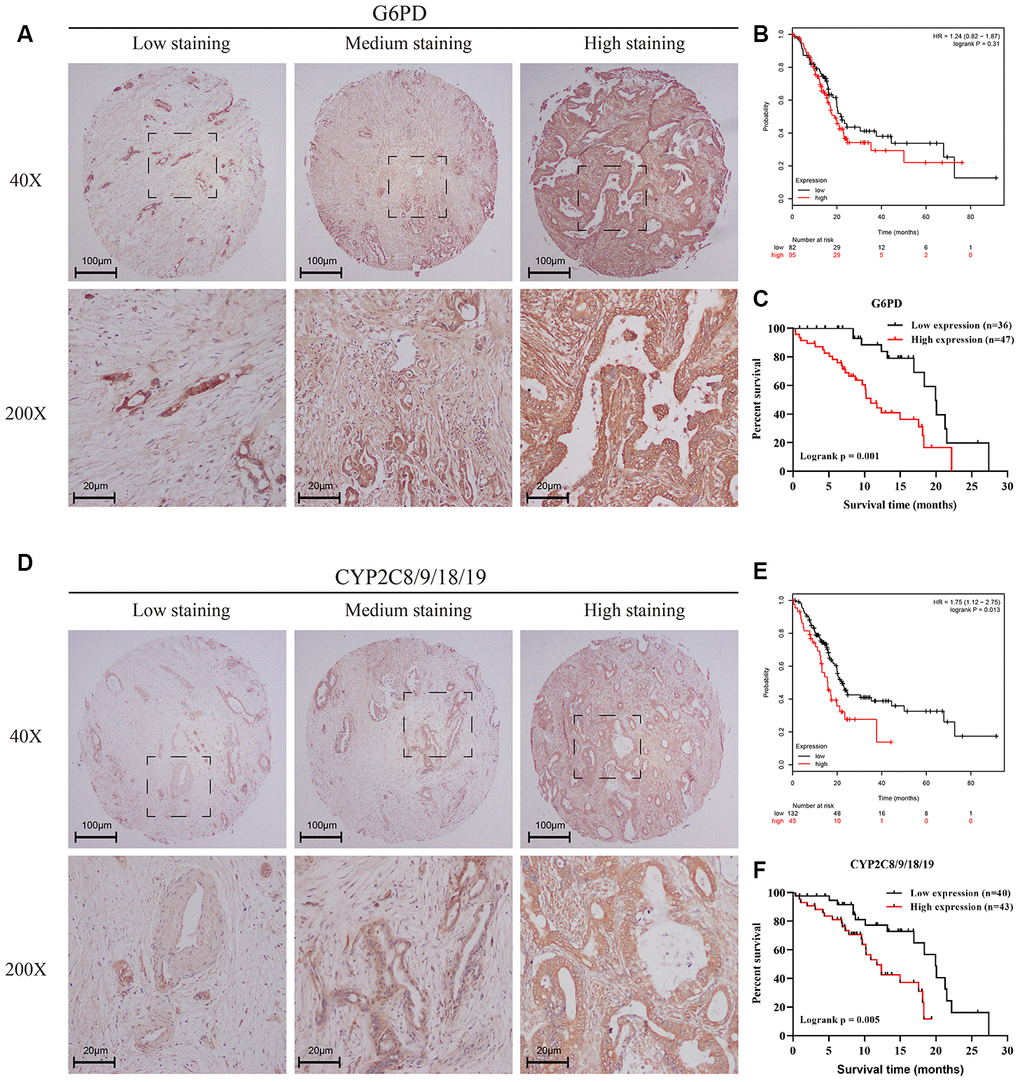
Figure 6.Verification of the effects of the pentose phosphate pathway and linoleic acid metabolism in PC using a tissue microarray. (A, D) IHC staining of a tissue microarray containing 83 PC patients with the G6PD antibody (A) or CYP2C8/9/18/19 (D) antibody. Intensity was classified as 0, 1+, 2+, and 3+, denoting no, weak, moderate, and strong staining, respectively. The distribution of staining was referred to as the percentage of positive tumor cells (0% to 100%). (B, E) Kaplan–Meier curves for overall survival of PC patients with different expression levels of G6PD (B) and CYP2C8/9/18/19 (E) according to the TCGA-PAAD mRNA-seq dataset. Black line represented low expression group and red line represented high expression group. (C, F) Kaplan–Meier curves for overall survival of PC patients with different expression levels of G6PD (C) and CYP2C8/9/18/19 (F) according to the IHC results of the tissue microarray containing 83 PC patients. The final G6PD and CYP2C8/9/18/19 expression scores were obtained by multiplying the two variables, intensity and distribution of staining. All samples were further divided into a low expression group and a high expression group according to the expression scores of G6PD (C) and CYP2C8/9/18/19 (F). Black line represented low expression group and red line represented high expression group.