Submit an Article
Navigate
Home
Editorial Board
Editorial Policies
Current Volume
Archive
Scientific Integrity
Publication Ethics Statements
Interviews with Outstanding Authors
Newsroom
Sponsored Conferences
Podcast
Contact
Special Collections
Submit an Article
Online ISSN: 1945-4589
Review
|
Volume 12, Issue 22
|
pp. 23409–23421
Impact of cardiovascular and metabolic diseases on the severity of COVID-19: a systematic review and meta-analysis
Back to article
Figure 3
(3 of 4)
−
100%
+
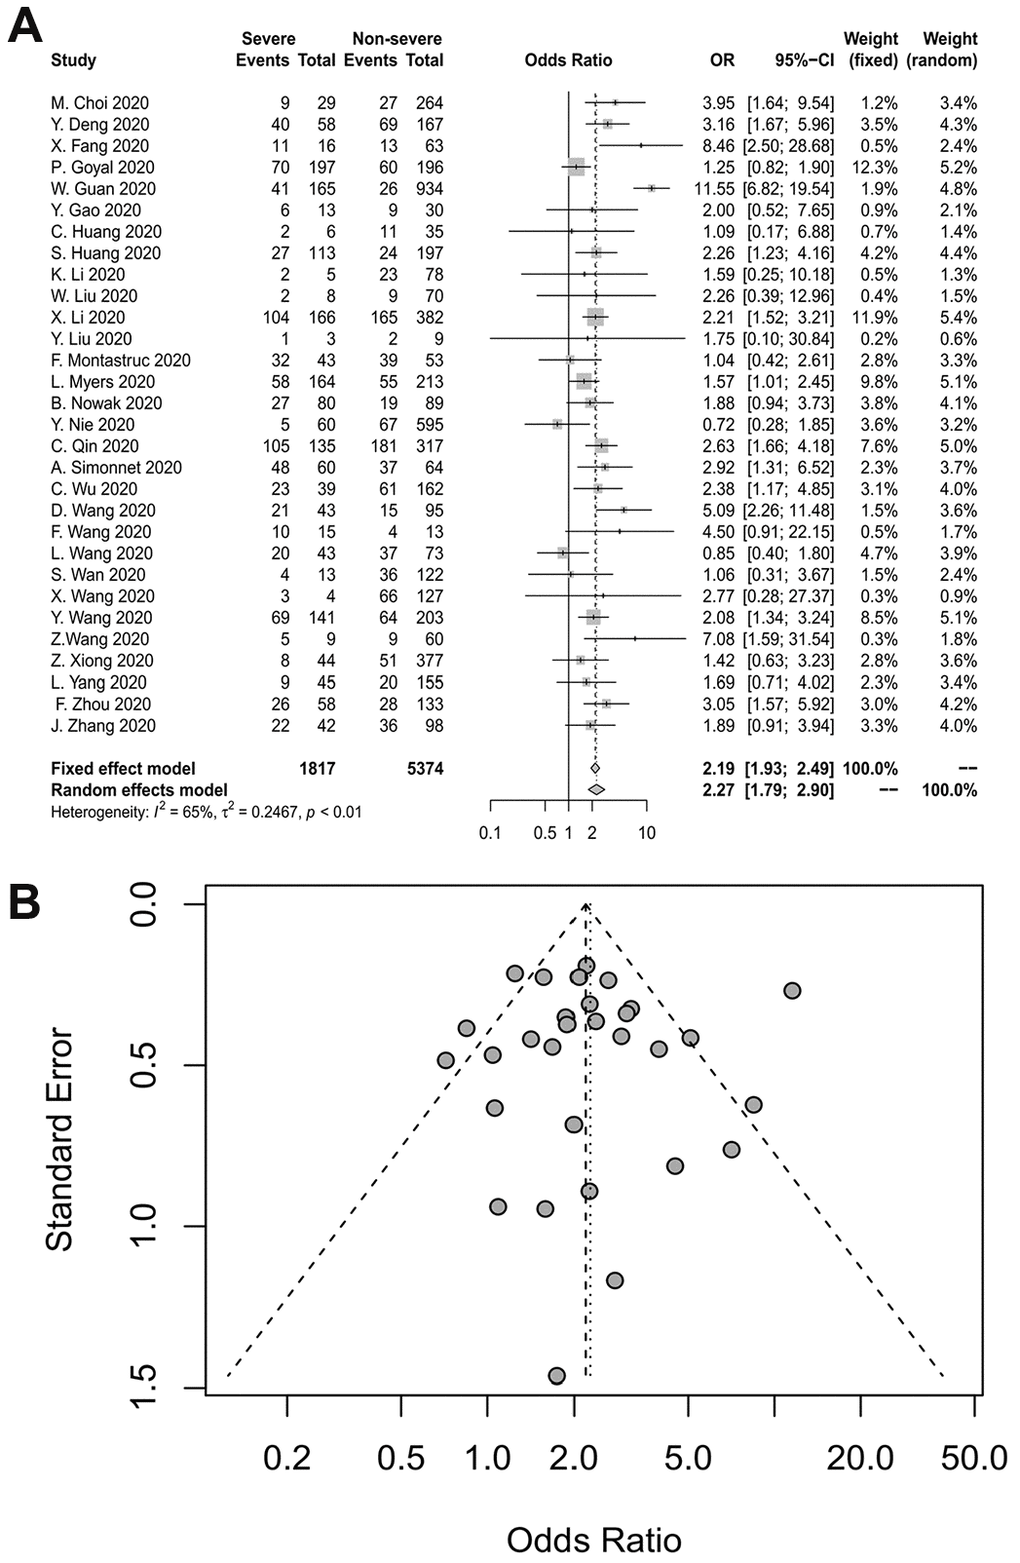
Figure 3.
(
A
) Forest plot for hypertension. (
B
) Funnel plot for hypertension.
Figure 3 — Impact of cardiovascular and metabolic diseases on the severity of COVID-19: a systematic review and meta-analysis | Aging