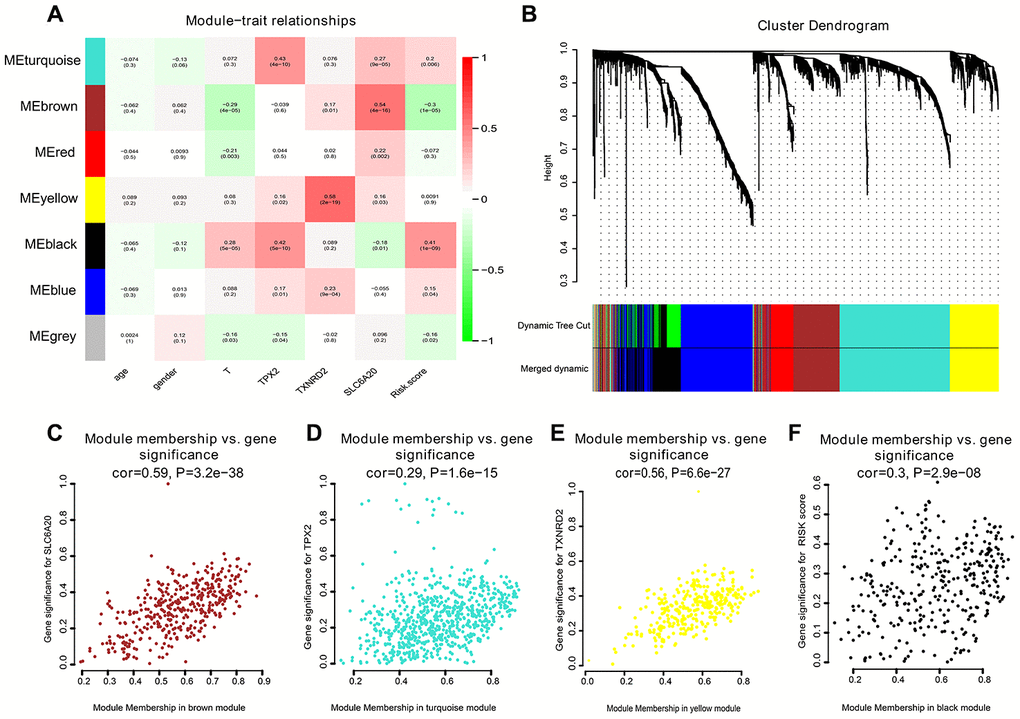
Figure 6.Correlation heat map among various phenotype and co-expression modules. (A) The correlation heat map. (B) The hierarchical clustering tree was showed, where each leaf on the tree represents a gene, and each branch represents a co-expression module. (C) SLC6A20 co-expression module factors were shown. The horizontal axis is module membership; the vertical axis is gene significance. (D) TPX2 co-expression module factors. The horizontal axis is module membership; the vertical axis is gene significance. (E) TXNRD2 co-expression module factors were shown. The horizontal axis is module membership; the vertical axis is gene significance. (F) Risk score correlation module. The horizontal axis is module membership; the vertical axis is gene significance.