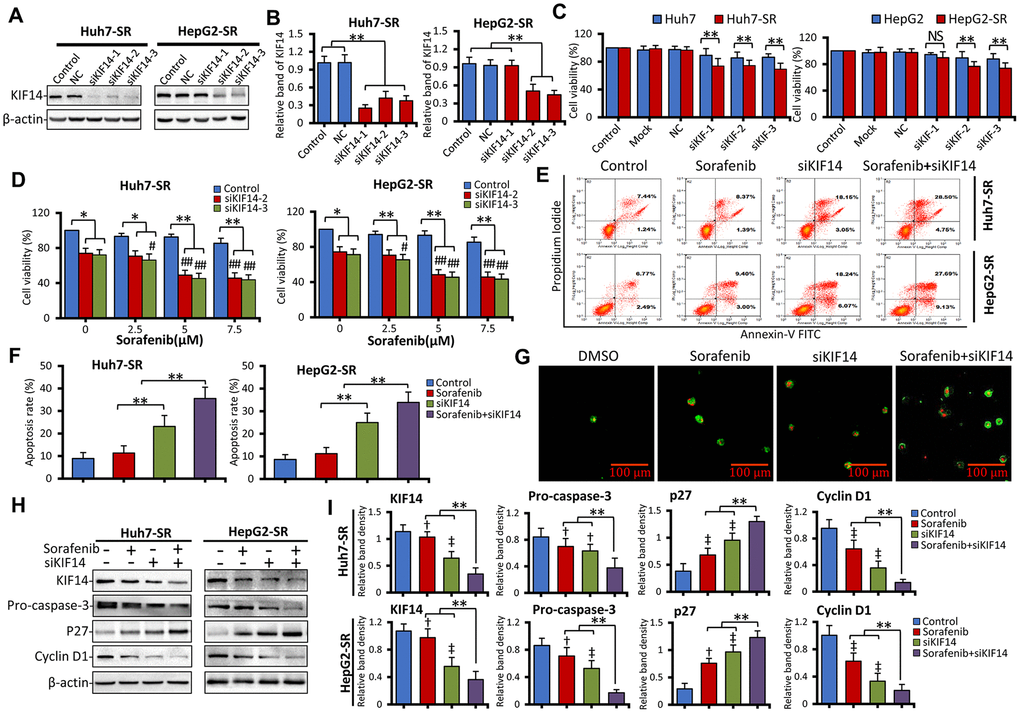
Figure 3.Silencing of KIF14 reverses acquired resistance to sorafenib in sorafenib-resistant HCC cells. (A and B) Sorafenib-resistant Huh7-SR and HepG2-SR cells were transfected with siKIF14 or negative control (NC) for 48 h. The corresponding untransfected cells served as the control. The protein expression profiles were detected by western blotting (A). The density of each band was normalized to that of β-actin (B). (C) Huh7-SR and HepG2-SR cells and the corresponding parent cells were transfected with siKIF14 or NC for 48 h. The transfection reagents served as the mock control. The corresponding untransfected cells served as the control. Cell viability (%) of transfected cells was compared with that of the corresponding untreated cells. (D) Huh7-SR and HepG2-SR cells were transfected with control or siKIF14 for 24 h and subsequently incubated with increasing concentrations of sorafenib for 24 h. The cell viability (%) of transfected cells was compared with that of the corresponding untreated cells. (E and G) Huh7-SR and HepG2-SR cells were transfected with control or siKIF14 for 24 h and subsequently incubated with 0 or 5 μM sorafenib for 24 h. (E and F) Flow cytometry was used to detect apoptosis and measure the rate of apoptosis. (G) Representative images were acquired from Huh7-SR cells stained with annexin V–fluorescein isothiocyanate (FITC)/propidium iodide (PI) and viewed by microscopy. Green fluorescent membranes alone represented early-stage apoptotic cells, and green fluorescent membranes in combination with red fluorescent nuclei represented late-stage apoptotic cells. (H and I) Cells from (E) were subjected to western blotting to detect the protein expression profiles. The density of each band was normalized to that of β-actin. Data represent three independent experiments. Scale bar = 100 μm. NS, not significant. “**” Indicates P<0.001; “†” indicates P<0.05, and “‡” indicates P<0.001 versus untreated parent cells; # indicates P<0.05, and “##” indicates P<0.001 versus siKIF14 alone.