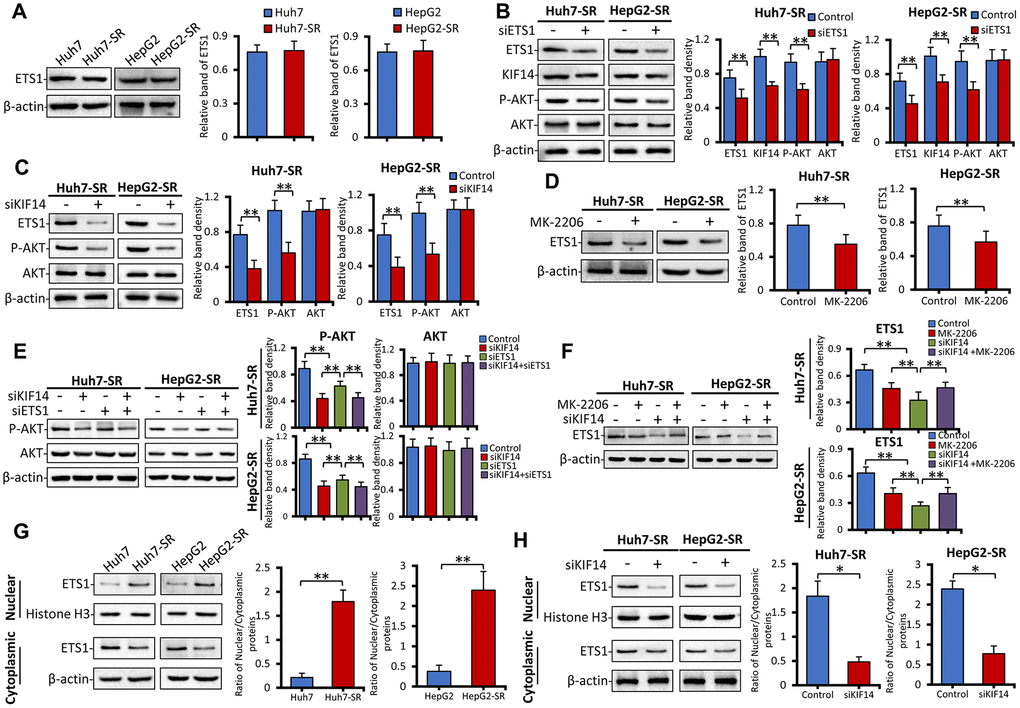
Figure 5.The AKT–ETS1–KIF14 positive feedback loop is responsible for the activation of KIF14. (A) The protein expression profiles ETS1 in sorafenib-resistant Huh7-SR and HepG2-SR cells and the corresponding parent cells were detected by western blotting. Representative protein bands are shown. The density of each band was normalized to that of β-actin. (B) Huh7-SR and HepG2-SR cells were transfected with control or siETS1 for 48 h. The protein expression profiles of ETS1, AKT, p-AKT, and KIF14 were detected by western blotting. The density of each band was normalized to that of β-actin. (C) Huh7-SR and HepG2-SR cells were transfected with control or siKIF14 for 48 h. The protein expression profiles of ETS1, AKT, and p-AKT were detected by western blotting. The density of each band was normalized to that of β-actin. (D) Huh7-SR and HepG2-SR cells were incubated with 0 or 10 μM MK-2206 for 48 h. The protein expression profile of ETS1 was detected by western blotting. The density of each band was normalized to that of β-actin. (E) Huh7-SR and HepG2-SR cells were transfected with control or siKIF14 for 24 h and subsequently transfected with control or siETS1 for another 24 h. The protein expression profiles of AKT and p-AKT were detected by western blotting. The density of each band was normalized to that of β-actin. (F) Huh7-SR and HepG2-SR cells were incubated with 0 or 10 μM MK-2206 for 24 h and subsequently transfected with control or siKIF14 for another 24 h. The protein expression profile of ETS1 was detected by western blotting. The density of each band was normalized to that of β-actin. (G and H) The nuclear and cytoplasmic protein expression profiles of ETS1 in sorafenib-resistant cells, and the corresponding parent cells from (A) were detected by western blotting (G). The nuclear and cytoplasmic protein expression profiles of ETS1 in Huh7-SR and HepG2-SR cells, transfected with control or siKIF14 from (C), were detected by western blotting (H). The band density of nuclear and cytoplasmic proteins was normalized to that of Histone H3 and β-actin, respectively. The ratio of nuclear/cytoplasmic protein was calculated. Data represent three independent experiments. “*” Indicates P<0.05 and “**” indicates P<0.001.