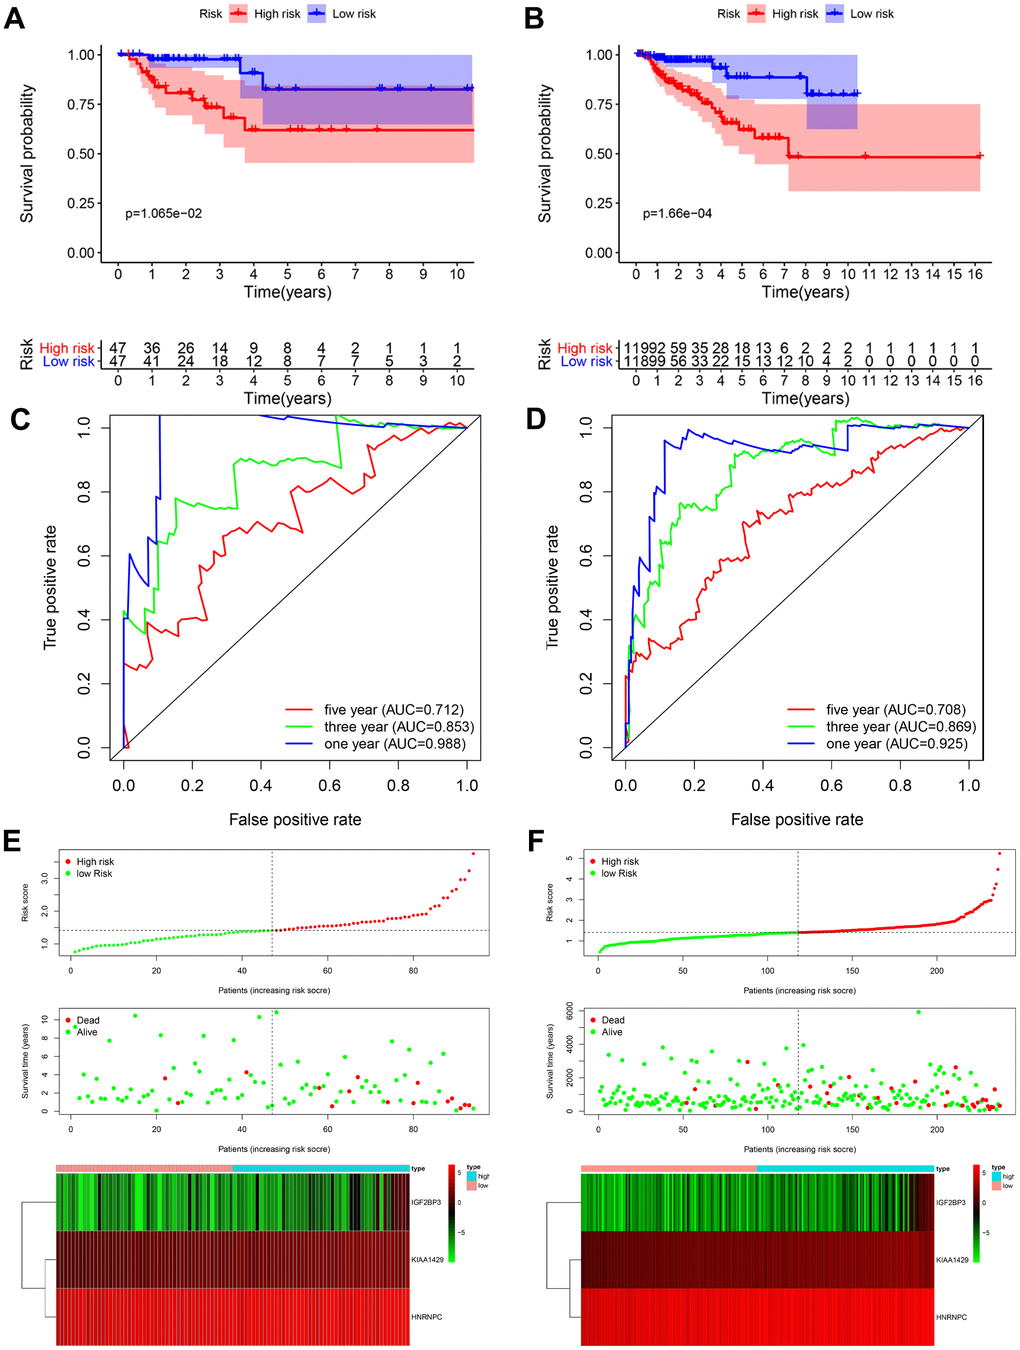
Figure 4.Validation of the prognostic risk signature in the testing cohort and entire cohort. (A) Kaplan-Meier curve analysis shows the overall survival rates of high-risk (n=47) and low-risk (n=47) KIRP patients in the testing cohort. (B) Kaplan-Meier curve analysis shows the overall survival rates of high-risk (n=119) and low-risk (n=118) KIRP patients in the entire TCGA cohort. (C, D) ROC curve analyses of the (C) testing cohort and (D) the entire TCGA-KIRP cohort show the false positive rate vs. true positive rate plots based on the prognostic risk signature. The AUC values for 1-year (blue), 3-year (green), and 5-year (red) survival rates are also shown. (E, F) The risk score distribution, survival status and prognostic risk gene expression in the (E) testing cohort and (F) entire TCGA-KIRP cohort is shown.