Submit an Article
Navigate
Home
Editorial Board
Editorial Policies
Current Volume
Archive
Scientific Integrity
Publication Ethics Statements
Interviews with Outstanding Authors
Newsroom
Sponsored Conferences
Podcast
Contact
Special Collections
Submit an Article
Online ISSN: 1945-4589
Research Paper
|
Volume 12, Issue 21
|
pp. 22122–22138
Weighted gene correlation network analysis identifies microenvironment-related genes signature as prognostic candidate for Grade II/III glioma
Back to article
Figure 9
(9 of 9)
−
100%
+
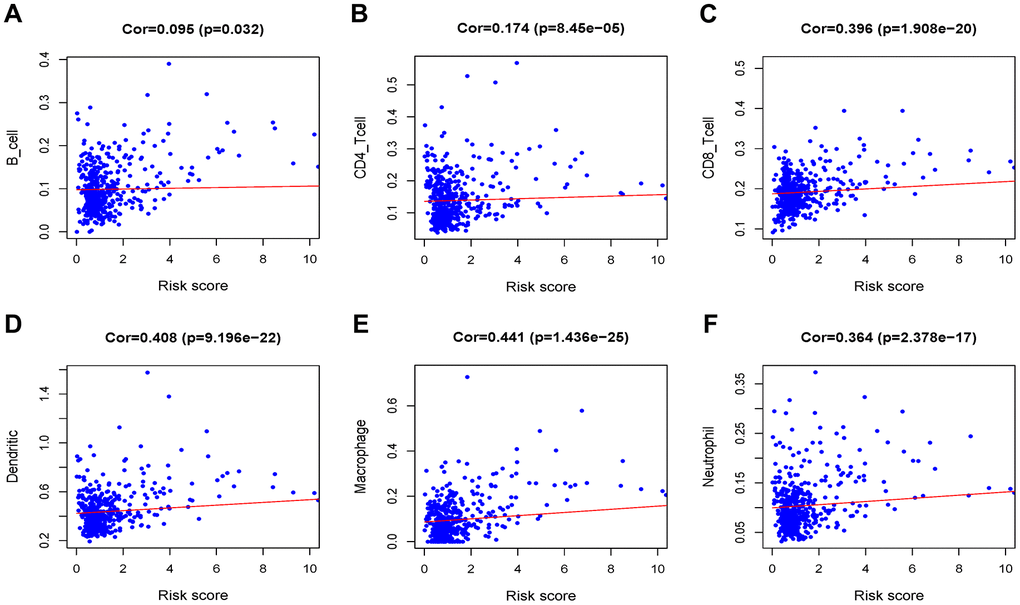
Figure 9.
Analysis of the correlation between the risk score and immune cell infiltration in the TCGA cohort.
(
A
) B cells. (
B
) CD4+ T cells. (
C
) CD8+ T cells. (
D
) Dendritic cells. (
E
) Macrophages. (
F
) Neutrophils.