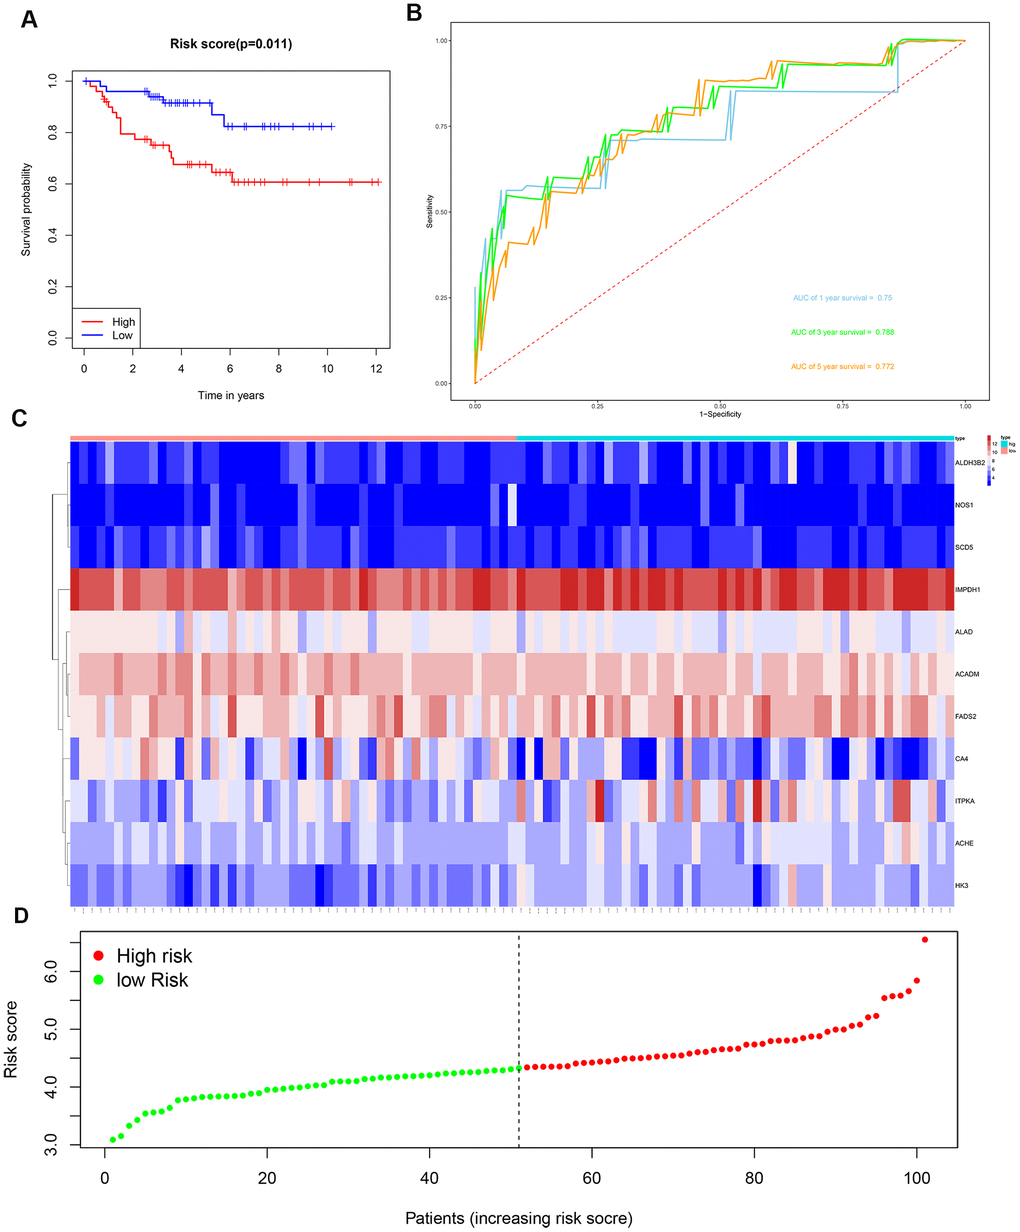
Figure 8.Risk score analysis of the 11 metabolic gene signature-related prognostic model in the E-MTAB-1980 cohort. (A) Kaplan-Meier survival curve analysis shows the overall survival of high- (n=50) and low-risk (n=51) ccRCC patients from the E-MTAB-1980 cohort based on the median risk score calculated using the 11 metabolic gene signature-based prognostic model. (B) Time dependent ROC curve analysis shows the prognostic performance of the 11 metabolic gene signature-based prognostic model in predicting 1-year, 3-year, and 5-year survival times of the ccRCC patients from the E-MTAB-1980 cohort. (C) Heat map shows the expression of the 11 metabolic genes in high- and low-risk ccRCC patients from the E-MTAB-1980 cohort. (D) Risk curve analysis of the 11 metabolic genes in high- and low-risk ccRCC patients from the E-MTAB-1980 cohort.