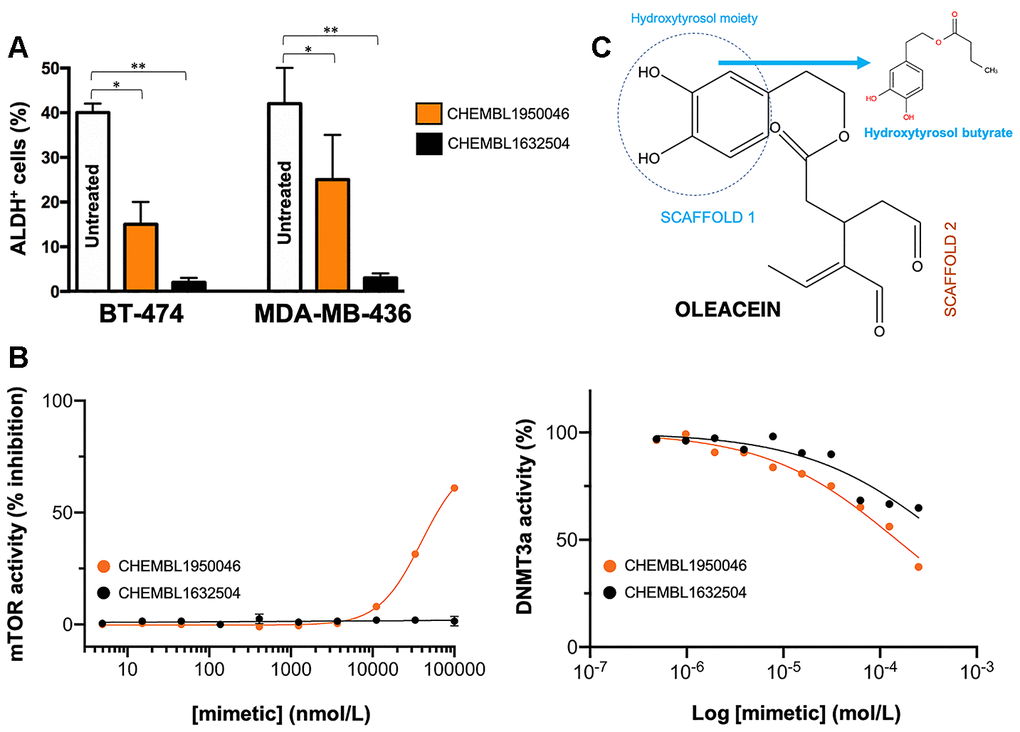
Figure 6.Phenotypic screening of the anti-CSC activity of oleacein mimetics (III). (A) Changes in the number of ALDH+ cells in BT-474 and MDA-MB-436 populations cultured in the absence or presence of 11.1 μmol/L of CHEMBL1950046 and CHEMBL1632504. The results are expressed as percentages means (columns) ± SD (bars). *P < 0.05 and **P < 0.005, statistically significant differences from the untreated (control) group. (B) Left. A dose-response inhibition curve of ATP-dependent activity of mTOR kinase was created by plotting FRET signal of the Z´-LYTE Kinase assay as the function of CHEMBL1950046 and CHEMBL1632504 concentrations. Right. Dose-response curves of SAM-dependent methylation activity of DNMT3A were created by plotting radioisotope signals of the HotSpotSM assay as the function of CHEMBL1950046 and CHEMBL1632504 concentrations. (C) Molecular scaffolds of oleacein.