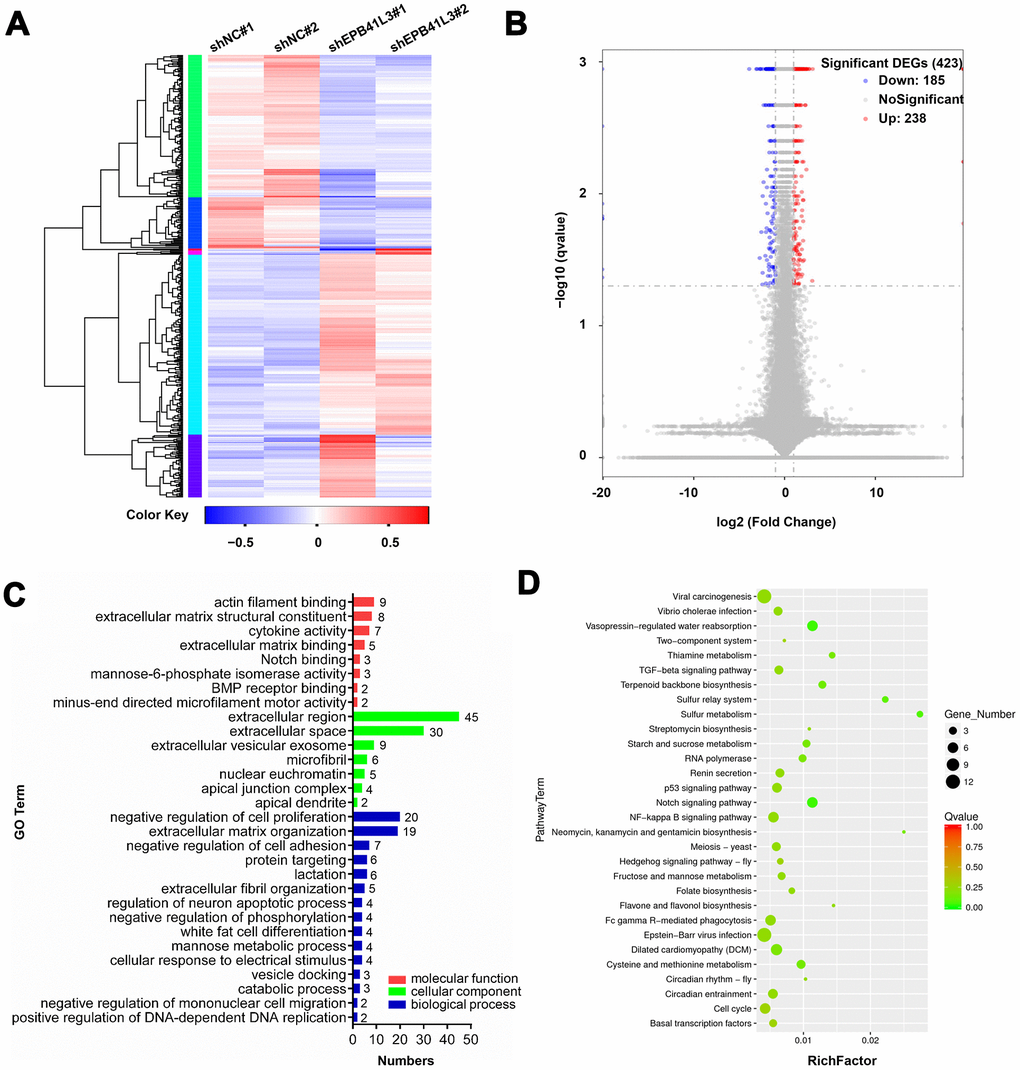
Figure 3.Downstream genes of EPB41L3 are identified through RNA-seq. (A) Heatmap of DEGs following depletion of EPB41L3. RNA sequencing analysis was conducted with U2OS cells stably expressing shNC or shEPB41L3. (B) The volcano plot of all 423 DEGs including 185 downregulated genes (blue dots) and 238 upregulated genes (red dots) based on an adjusted p≤0.05 and log FC≥1. (C) GO enrichment analysis of DEGs consisting of biological processes, cellular component, and molecular functions, was plotted according to the gene numbers. (D) KEGG pathway enrichment bubble chart of DEGs. The color of bubble means the significance of the corresponding KEGG pathway (in green color, low Q-value, insignificantly; in red color, high Q-value, significantly). As well, the size of bubble means the number of DEGs in this pathway. DEGs, different expression genes; FC, fold change; GO, gene ontology; KEGG, Kyoto Encyclopedia of Genes and Genomes.