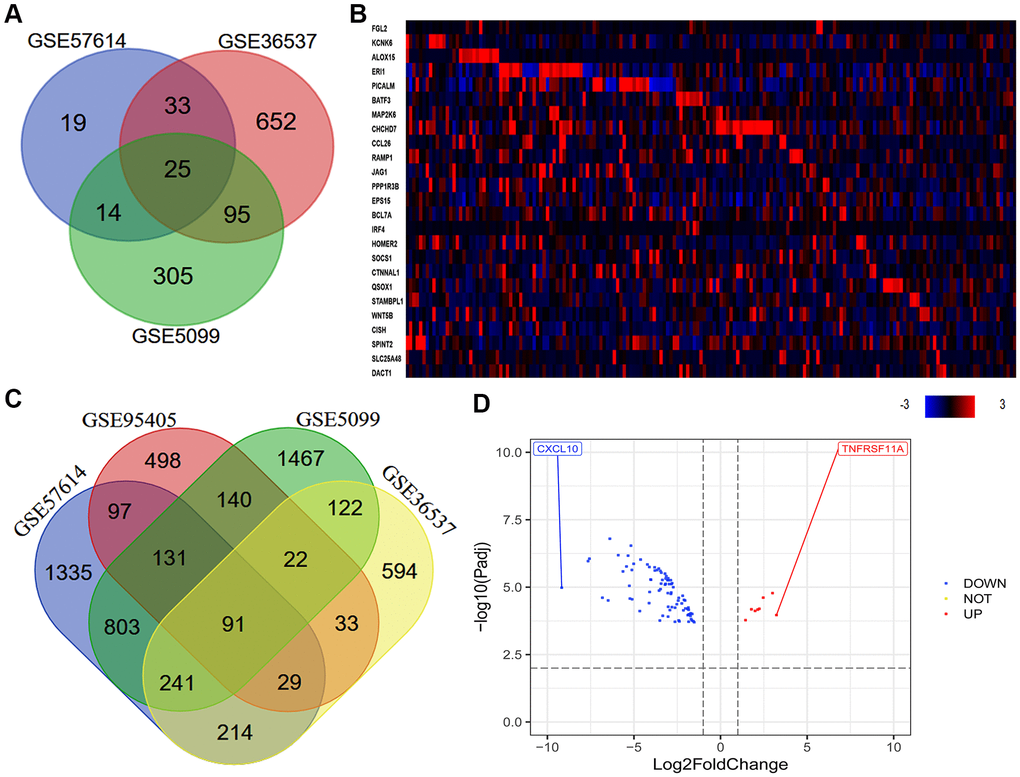
Figure 2.Quantitative analysis of DEGs between macrophages of different phenotypes. (A) In total, 25 consistently DEGs between M0 macrophages and M2 macrophages were identified in three datasets (GSE57614, GSE36537 and GSE5099) based on a |logFC| ≥ 1.0 and an adjusted P-value < 0.05. (B) In total, 91 consistently DEGs between M1 and M2 macrophages were identified in four datasets (GSE57614, GSE36537, GSE5099 and GSE95405) based on a |logFC| ≥ 1.0 and an adjusted P-value < 0.01. (C) The levels of the 25 consistently DEGs in ESCA samples from TCGA (tumor = 184) are shown as a heatmap, as quantified using cBioPortal. High, medium and low gene levels are represented in red, black and blue, respectively. (D) Volcano plot of the 91 consistently DEGs between M1 and M2 macrophages. The red spots represent the 8 upregulated genes and the blue spots indicate the 83 downregulated genes in M2 macrophages compared with M1 macrophages.