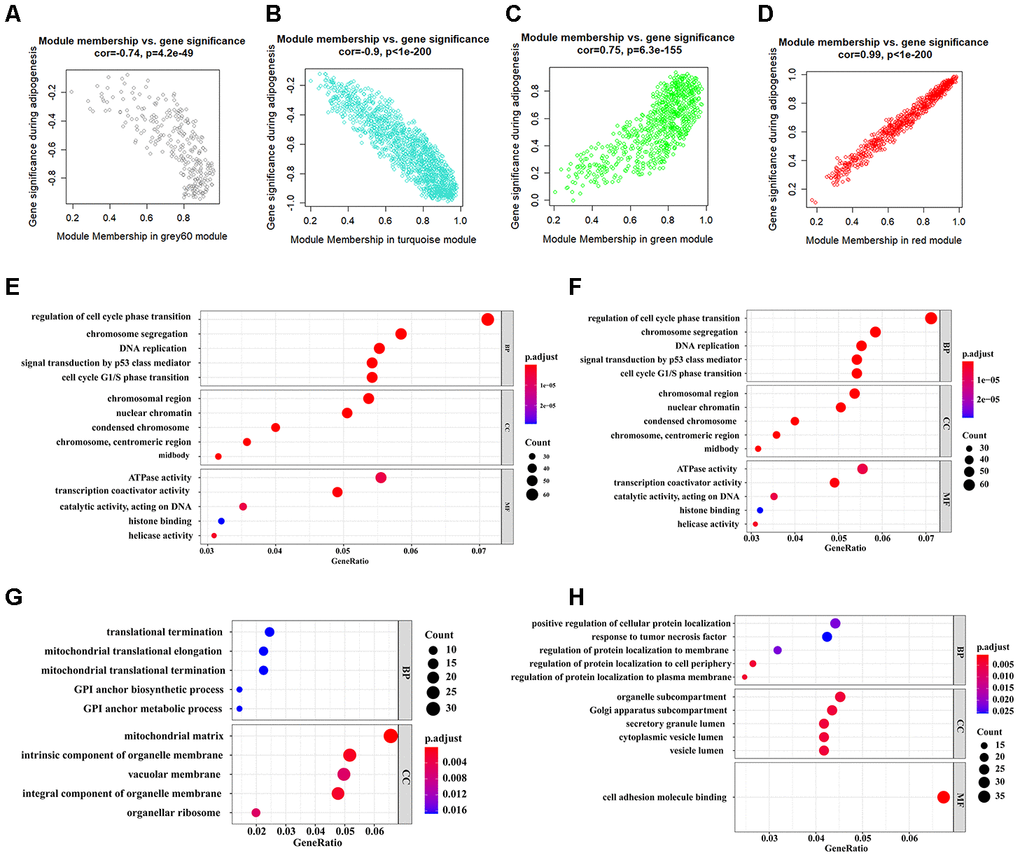
Figure 3.Identification of functional annotation of the WGCNA module that correlated highly with adipogenesis. (A–D) Scatter plot of module Eigengenes in the grey 60 module (A), turquoise module (B), green module (C), and red module (D). (E–H) Biological process GO terms for genes in the grey 60 module (E), turquoise module (F), green module (G), and red module (H). P-value cutoff = 0.01; q-value cutoff = 0.05. GO, Gene Ontology.