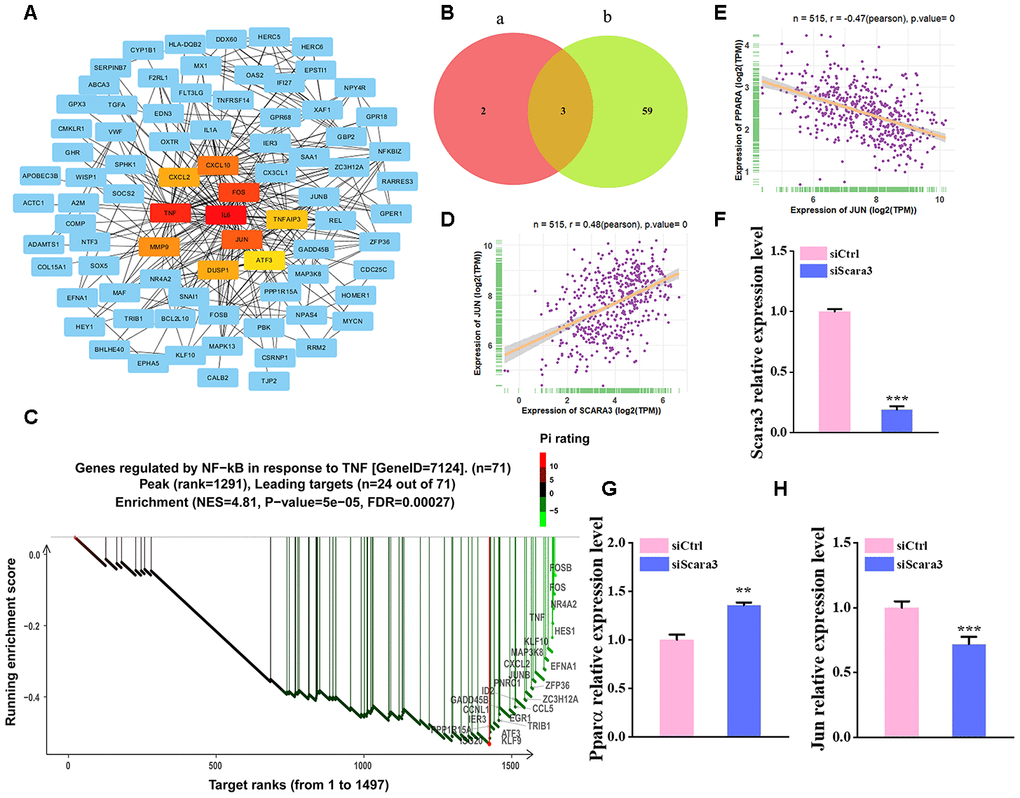
Figure 8.Selection of the transcription factors of SCARA3. (A) PPI network of the DEGs from GSE100748. (B) Venn diagram for shared genes through the PROMO (a) and GENECARD (b) databases. (C) GSEA analysis of the DEGs from GSE100748. (D) Correlation of SCARA3 with JUN in expression in adipose tissue, based on data from GTEx databases. (E) Correlation of JUN with PPARA expression in adipose tissue, based on data from GTEx databases. (F) qRT-PCR analysis of depletion of Scara3. (G–H) qRT-PCR analysis of the relative levels of Pparα (G) and Jun (H). Error bars show standard deviation. **P < 0.01, ***P < 0.001.