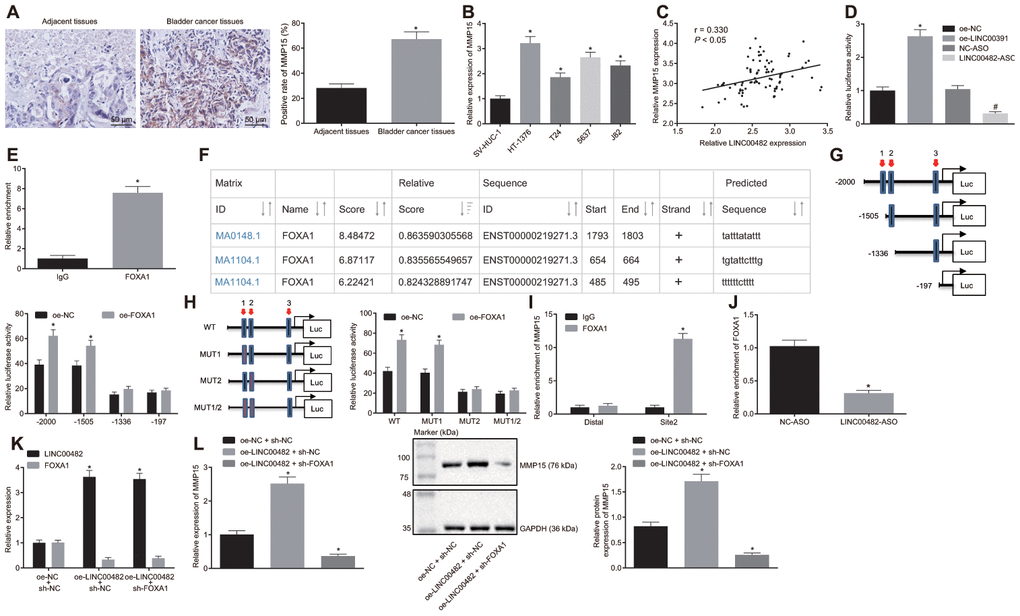
Figure 4.LINC00482 up-regulates the expression of MMP15 by recruiting FOXA1. (A) MMP15 expression in bladder cancer and adjacent normal tissues detected by immunohistochemistry (× 200), * p < 0.05 vs. adjacent normal tissues; (B) Expression of MMP15 in 4 kinds of bladder cancer cells and SV-HUC-1 cell detected by RT-qPCR; * p < 0.05 vs. SV-HUC-1 cell; (C) The correlation between LINC00482 and MMP15 expression in the bladder cancer tissues analyzed by Pearson correlation coefficient; (D) Dual-luciferase reporter gene assay was used to study the effect of LINC00482 on the activity of MMP15 promoter, * p < 0.05 vs. the oe-NC group, # p < 0.05 vs. the NC-ASO group; (E) The interaction between LINC00482 and FOXA1 verified by RIP assay, * p < 0.05 vs. the IgG group; (F) FOXA1 protein might combine the three sites of MMP15 promoter region by online analysis; (G) The truncated MMP15 recombinant luciferase reporter vector co-transfected with FOXA1 expression vector into HT-1376 cells for dual-luciferase reporter assay, * p < 0.05 vs. the oe-NC group; (H) the mutated MMP15 recombinant luciferase reporter vector co-transfected with FOXA1 expression vector into HT-1376 cells for dual-luciferase reporter assay, * p < 0.05 vs. the oe-NC group; (I) Enrichment of FOXA1 at site 2 in MMP15 promoter region analyzed by ChIP assay, * p < 0.05 vs. the IgG group; (J) Enrichment FOXA1 on MMP15 after silencing LINC00482 in HT-1376 cells detected by ChIP assay, * p < 0.05 vs. the NC-ASO group; (K) Transfection efficiency of LINC00482 and FOXA1 in each group by RT-qPCR, * p < 0.05 vs. cells treated with oe-NC + sh-NC; (L) The expression of MMP15 after treatment of oe-LINC00482 and sh-FOXA1 detected by RT-qPCR and Western blot analysis, * p < 0.05 vs. cells treated with oe-NC + sh-NC. The measurement data were presented as mean ± standard deviations. Paired t-test was used for intra-group comparison, while differences between two groups were compared by unpaired t test. Comparisons among multiple groups were analyzed by one-way analysis of variance, followed by Tukey’s post-hoc test. Experiments were repeated three times.