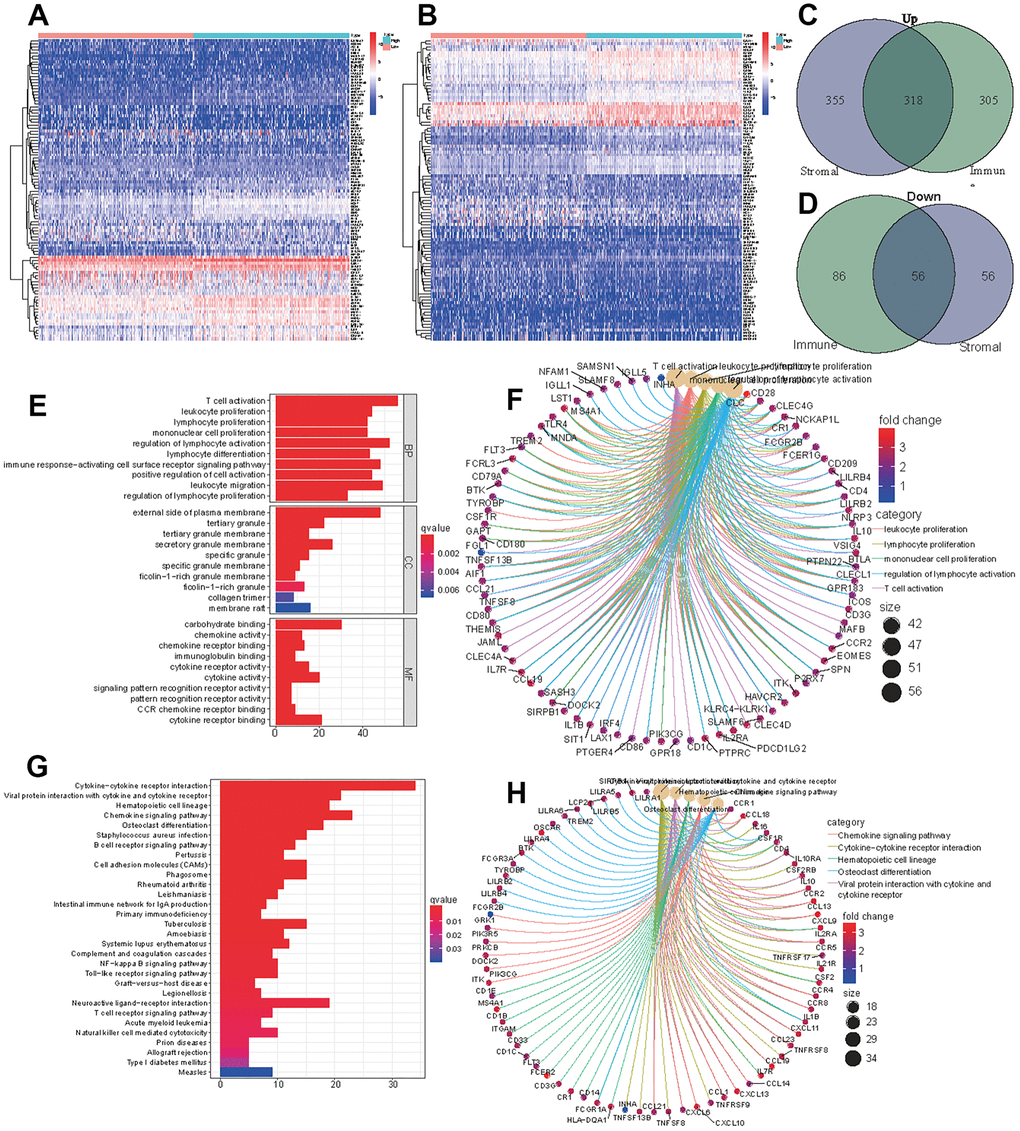
Figure 2.DEGs of high immune score (stromal score) and low score groups and functional enrichment analysis. Heatmap of significantly differentially expressed genes based on immune (A) and stromal (B) scores for LUAD. Venn diagram analysis of high (C) and low (D) expressed genes based on immune and stromal scores. (E) GO analysis of aberrantly expressed genes at the intersection of two groups. (F) CircleMap showing the functional interactions between pathways and genes as extracted from GO. (G) KEGG analysis of aberrantly expressed genes at the intersection of two groups. (H) CircleMap showing the functional interactions between pathways and genes as extracted from KEGG.