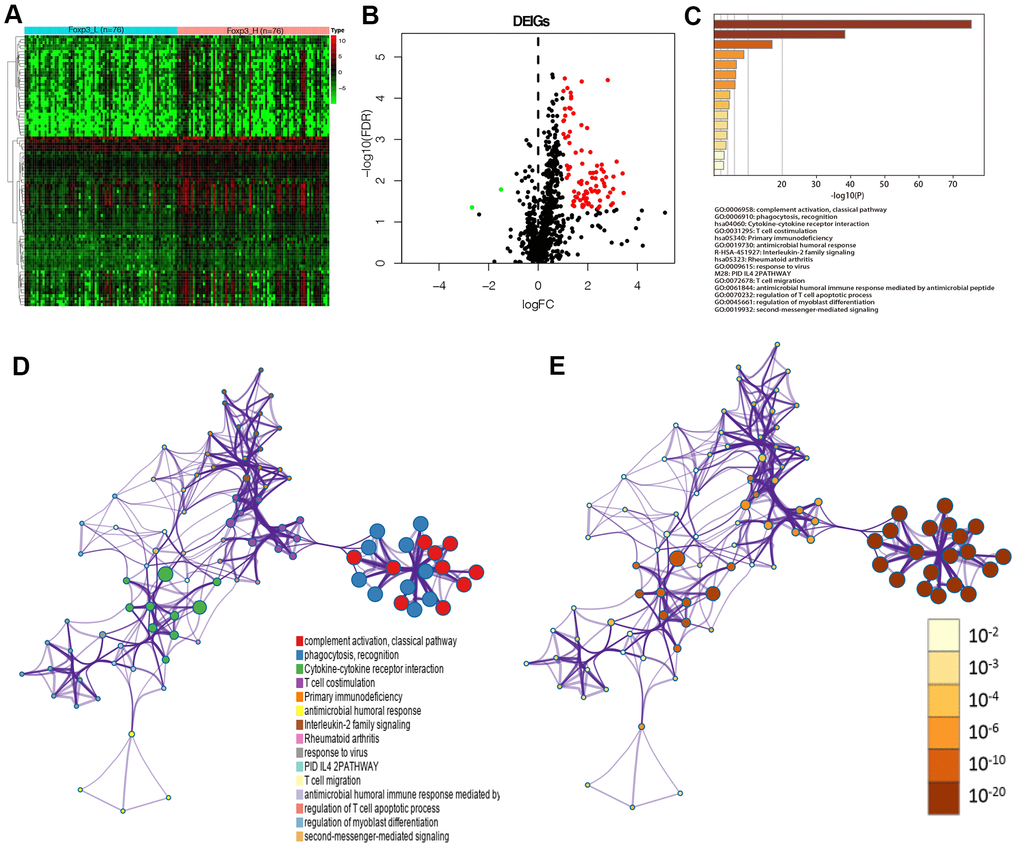
Figure 3.Identification of Foxp3-associated differentially expressed immune genes. (A) Heatmap of immune genes differentially expressed between Foxp3_H (n=76) and Foxp3_L (n=76). (B) Volcano plot of 91 immune genes differentially expressed between Foxp3_H and Foxp3_L. (C) Heatmap of enriched terms across input gene lists, colored by P-values. (D) Enriched terms are colored by cluster ID, where nodes that share the same cluster ID are typically close to each other in DEIGs. (E) Enriched terms are colored by P-value, where terms containing more genes have a more significant P-value in DEIGs.