


Introduction
Gliomas are the most common primary tumors in the human central nervous system (CNS) with more than half of them being World Health Organization (WHO) grade IV glioblastomas multiforme (GBM) [1]. Because glioblastomas are highly heterogeneous and invasive, surgery alone cannot eradicate the tumor and therefore, subsequent radiotherapy and chemotherapy are still required [2]. Although temozolomide has been called the biggest advancement in GBM chemotherapy [3], its therapeutic effect is still not ideal. The median survival time of GBM patients is only 14 months after standardized treatment [4].
The application of immunotherapy in non-small cell lung cancer and melanoma has provided a potential new approach to treating GBM [5, 6]. Studies of the anatomical structure of the CNS endolymphatic duct have shown that the CNS is not an immune exempt area [7]. CNS tumors can also be infiltrated by peripheral lymphocytes, which can have a meaningful therapeutic effect on existing CNS tumors. Nonetheless, GBM immunosuppressive microenvironment limits treatment effect. The glioblastoma tumor uses a variety of immunosuppressive mechanisms to promote growth and progression. GBM cells can downregulate immune activity by secreting immunosuppressive factors such as IL-1, TGF-β, and CSF-1 [8, 9]. They can also limit the compromise the immunity by expressing CD95, CD70, PD-L1, and other immunosuppressive factors [10, 11]. A number of clinical trials against these targets have been applied to glioblastoma patients, but the therapeutic effect is not satisfactory.
Foxp3+ regulatory T cells (Treg) play an important role in the glioma immunosuppressive microenvironment. Foxp3+ Tregs of glioma can bind to CD80 or CD86 via CTLA-4 to suppress T lymphocyte activity [12]. Foxp3 can also induce HO-1 expression resulting in the suppression of T lymphocyte proliferation [13]. In gliomas, Treg can inhibit dendritic cells, antigen-presenting cells, and other lymphocytes by inhibiting the secretion of IL-2, and IFN-γ, and promoting the secretion of TGF-β, IDO thus, creating an immunosuppressive microenvironment [14]. Although some studies have explored the immunosuppressive effect of Treg in glioma, the relationship between Foxp3 expression and the immune response has not yet been discussed in GBM.
In this study, we first performed an immunohistochemical examination for Foxp3 of tissue microarray slides of 72 high-grade glioma patients and analyzed the patients’ survival time. We then obtained RNA-seq data from The Cancer Genome Atlas (TCGA) and divided them into two groups based on Foxp3 expression, Foxp3 High (Foxp3_H), and Foxp3 Low (Foxp3_L). The enrichment levels of the 29-immune signature (Supplementary Table 2) which represented diverse immune cell types, functions, and pathways in each GBM sample of the two groups were then quantified [15]. The gene expression profiles were also analyzed to identify differentially expressed immune genes (DEIGs) between Foxp3_H and Foxp3_L. Subsequently, we used the Least Absolute Shrinkage and Selection Operator (LASSO) Cox regression analysis to construct an immune prognostic signature (IPS). Finally, a robust predictive nomogram model was developed to estimate overall survival (OS) for patients with GBM.
Results
Foxp3 expression is associated with prognosis
Clinicopathological details of patients in the prognosis cohort and their association with Foxp3 expression are summarized in Supplementary Table 1. IHC staining for Foxp3 was positive in 34 (47.2%) patients and negative in 38 (52.8%) patients. Foxp3 expression was very different in high-grade glioma tissues (Figure 1A). In the survival analysis, Foxp3 positivity was significantly associated with poor OS (p=0.04) (Figure 1B).
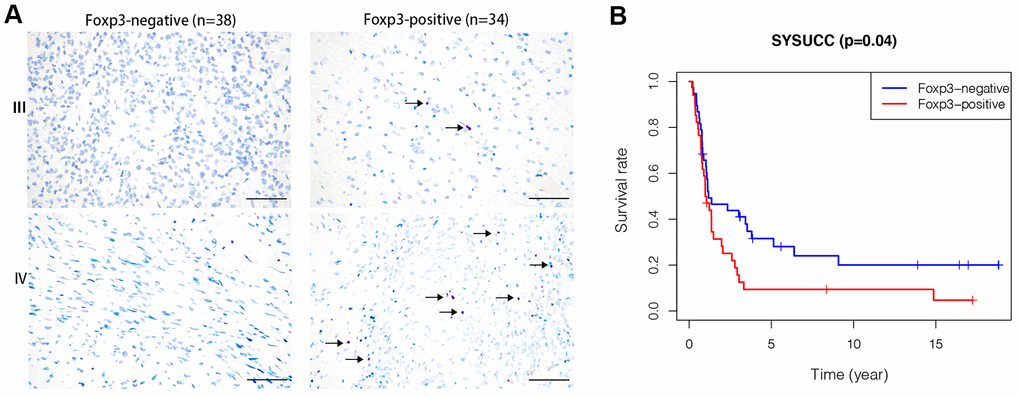
Figure 1. Foxp3 expression in high-grade gliomas from SYSUCC and survival analysis. (A) Foxp3 expression in 72 high-grade gliomas from SYSUCC, black arrows shows the positive cells. The scale bar represents 50 μm. (B) Comparison of survival prognosis between 34 Foxp3-positive patients and 38 Foxp3-negative patients from SYSUCC (Log-Rank test).
Immunogenomic analyses between Foxp3_H and Foxp3_L
The 152 patients in this study were equally divided into two groups: Foxp3_H and Foxp3_L, of 76 patients each. The ssGSEA score [16, 17] was applied to examine 29 sets of immune-associated genes (Supplementary Table 2) [15] representing different immune cell types, functions, and pathways in each GBM sample of the dataset. From the ssGSEA results, we found that immune cells, functions, and pathways were enriched in Foxp3_H (Figure 2A).
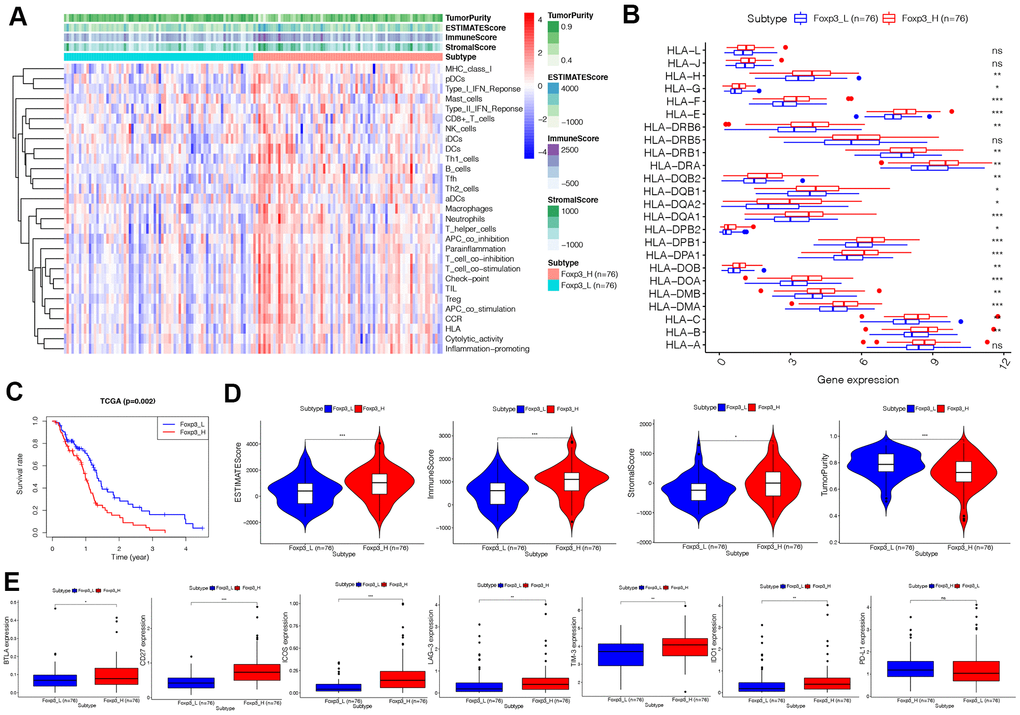
Figure 2. Immunogenomic analyses of Foxp3_H (n=76) and Foxp3_L (n=76) from TCGA. (A)The enrichment levels of the 29-immune signatures by ssGSEA score in each GBM sample. ESTIMATE was used to evaluate tumor purity, stromal score, and immune score. (B) Comparison of the expression levels of HLA genes between Foxp3_H and Foxp3_L using ANOVA test. (C) Comparison of survival prognosis between Foxp3_H and Foxp3_L from TCGA using the Log-Rank test. (D) Comparison of the Immune score, Stromal score, ESTIMATE score, Tumor purity between Foxp3_H, and Foxp3_L using Kruskal–Wallis test. (E) Comparison of immune checkpoint gene expression levels between Foxp3_H and Foxp3_L using ANOVA test. *P < 0.05, **P < 0.01, ***P < 0.001.
We then analyzed the expression of HLA genes and immune checkpoint genes. It was found that the expression of HLA genes was higher in Foxp3_H than Foxp3_L, except HLA-L, HLA-J, HLA-DRB5, and HLA-A (ANOVA test, P<0.05) (Figure 2B). Most immune checkpoint genes expressed were significantly higher in the Foxp3_H group, except PD-L1 (ANOVA test, P<0.05) (Figure 2E). These results indicated that patients in Foxp3_H suffered from an immunocompromising condition. This implied that the Foxp3_L might better respond to immune checkpoint inhibitors than the Foxp3_H.
Survival analyses showed that clinical outcomes were distinct between Foxp3_H and Foxp3_L (Figure 2C). The Foxp3_L had a better survival prognosis than the Foxp3_H (Log-Rank test, P=0.002). Additionally, we compared the immune score, stromal score, ESTIMATE score, and the tumor purity between Foxp3_H and Foxp3_L. We found that the immune scores (Kruskal–Wallis test, P < 0.001), ESTIMATE scores (Kruskal–Wallis test, P < 0.001), and stromal scores (Kruskal–Wallis test, P < 0.05) were higher in the Foxp3_H group whereas the tumor purity was higher in the Foxp3_L group (Kruskal–Wallis test, P < 0.001) (Figure 2D). Overall, these results indicated that Foxp3_H had more immune and stromal cells, while Foxp3_L had more tumor cells.
Identification of differentially expressed immune genes
Data were analyzed using Rstudio software (Version 1.2.5001) to confirm the DEGs between Foxp3_H and Foxp3_L. A total of 294 genes were identified by the criteria of log2 |fold change| ≥1 and FDR <0.05; among them, 261 genes were upregulated and the other 33 genes were downregulated (Supplementary Figure 1).
Ninety-one differentially expressed immune genes (DEIGs) were then selected using the ImmPort database [18] (Figure 3A, 3B). The DEIGs were uploaded to the Metascape website to identify Gene Ontology (GO) Terms and Kyoto Encyclopedia of Genes and Genomes (KEGG) pathways. The terms were considered significant and grouped into clusters when P <0.01 and the numbers of enriched genes ≥3, respectively based on their membership similarities. The terms with the best p-values were chosen from each of the 20 clusters, with not more than 15 terms per cluster and 250 terms in total. The DEIGs were mainly enriched in GO:0006958: complement activation, classical pathway, GO:0006910: phagocytosis, recognition, GO:0031295: T cell co-stimulation (GO terms), and hsa04060: cytokine-cytokine receptor interaction (KEGG) (Figure 3C). Each node represented an enriched term and was first colored by its cluster ID (Figure 3D) and then by its P-value (Figure 3E).
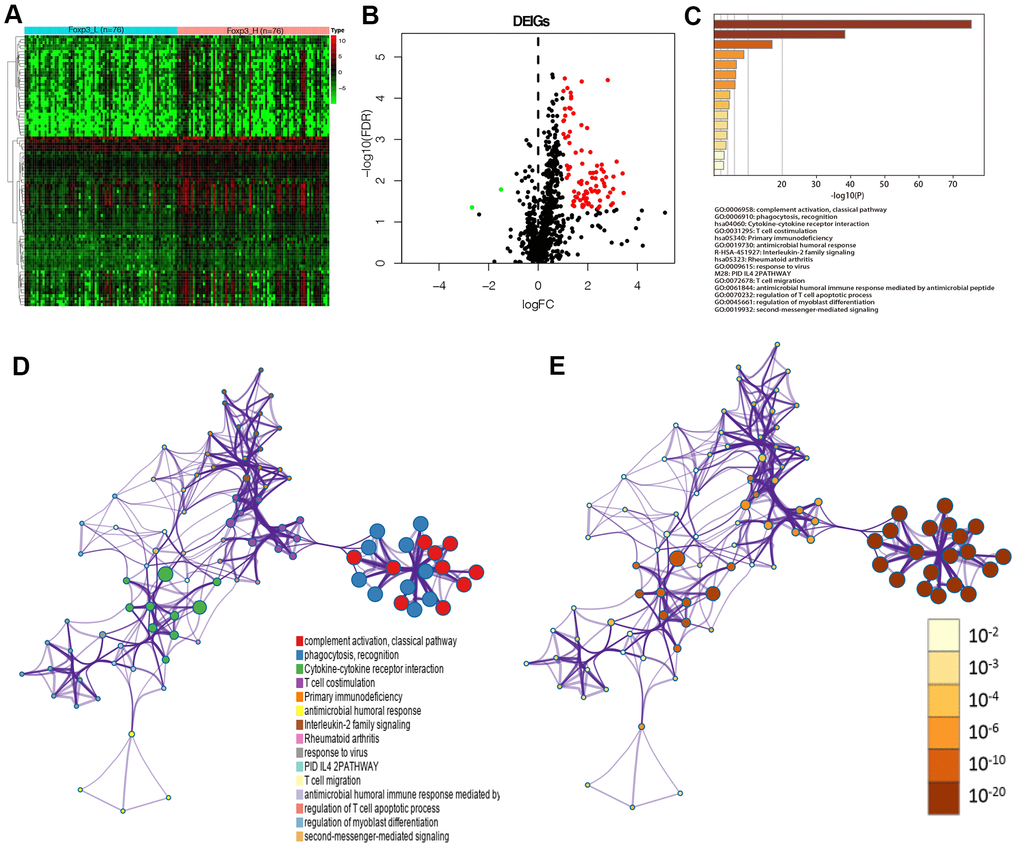
Figure 3. Identification of Foxp3-associated differentially expressed immune genes. (A) Heatmap of immune genes differentially expressed between Foxp3_H (n=76) and Foxp3_L (n=76). (B) Volcano plot of 91 immune genes differentially expressed between Foxp3_H and Foxp3_L. (C) Heatmap of enriched terms across input gene lists, colored by P-values. (D) Enriched terms are colored by cluster ID, where nodes that share the same cluster ID are typically close to each other in DEIGs. (E) Enriched terms are colored by P-value, where terms containing more genes have a more significant P-value in DEIGs.
Construction of the Foxp3-related immune prognostic signature
LASSO Cox regression analysis was used to construct an IPS for the training set (Figure 4A–C). Risk scores were calculated for each sample (risk score= CXCL5*0.077+IGHV3-11*0.317+TNFSF14*0.296+LGR6*0.054). Patients in the training set were divided into a low-risk group and a high-risk group based on the optimal cut-off value (0.6979717) calculated through the “survminer” R package. The outcomes of patients with a high-risk score were worse than those with a low-risk score, as suggested by Kaplan–Meier analysis (Figure 4D). The Receiver Operating Characteristic (ROC) curve analysis of the IPS in the training set indicated a promising prognostic ability for OS (Figure 4E). Figure 4F shows the results of risk score distribution and gene expression patterns in the training set.
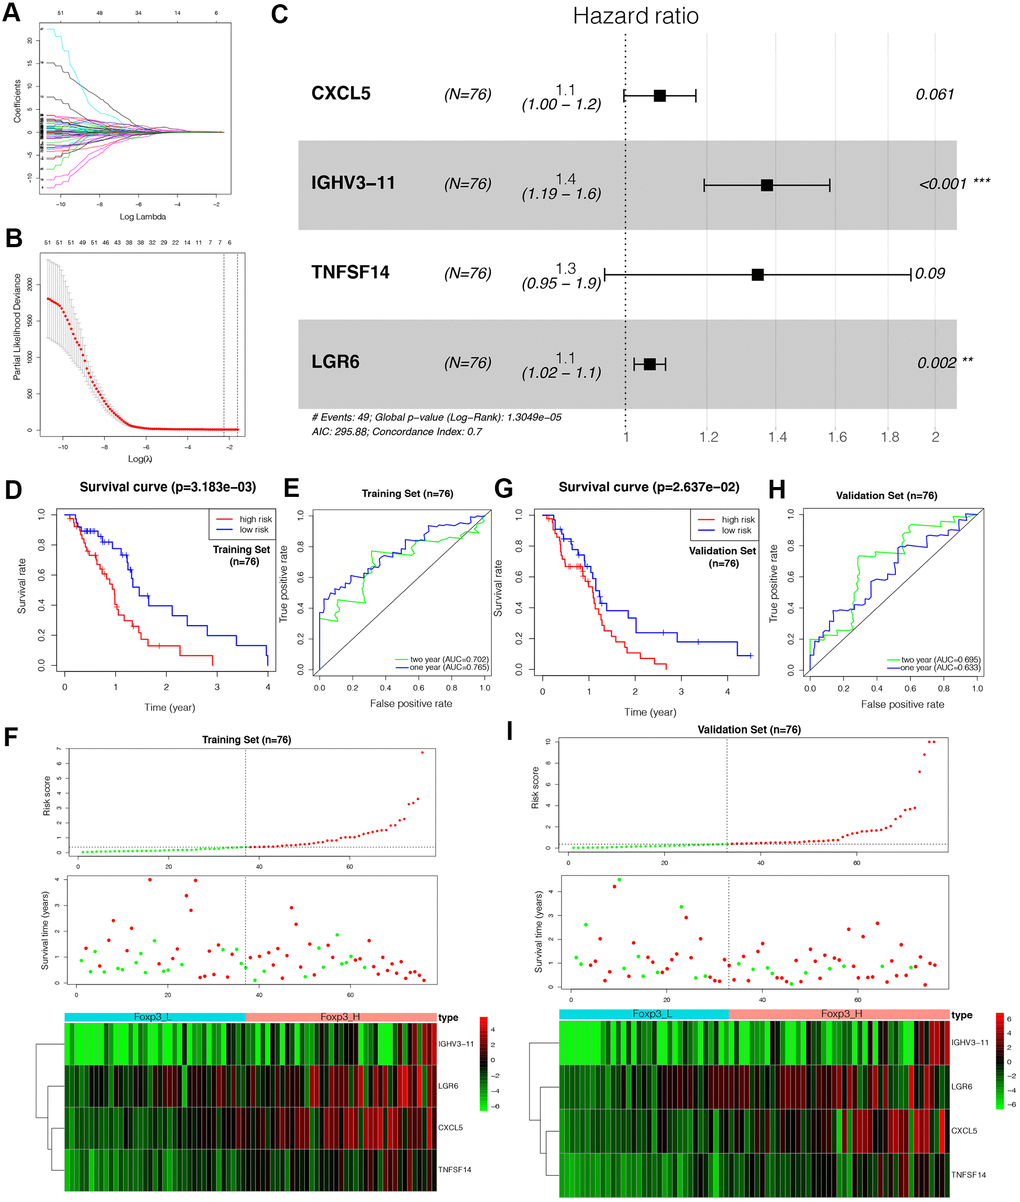
Figure 4. Construction of the Foxp3-related immune prognostic signature (IPS). (A–C) LASSO Cox analysis identified four genes most correlated with overall survival in the training set (n=76). (D, G) Kaplan–Meier curves of overall survival based on the IPS in the training set and validation set (n=76). (E, H) ROC curve analysis of the IPS. (F, I) Risk scores distribution, survival status of each patient, and heatmaps of prognostic four-gene signature in the training set (n=76) and validation set (n=76).
Validation of the immune prognostic signature
To verify the prognostic value of the IPS, the same formula was applied to the validation set. Patients in the validation set were divided into high- and low-risk by the cut-off value obtained from the corresponding cohort. Similar to the results of the outcomes in the training set, the patients with a high-risk score tended to have worse OS (Figure 4G). The ROC analysis displayed high sensitivity and specificity of the IPS (Figure 4H). The Area Under the Curve (AUC) values for predicting 1- and 2-year patient survival were 0.633 and 0.695, respectively, demonstrating the high predictive value of the IPS. Figure 4I shows the results of risk score distribution and gene expression patterns in the validation set. The prognostic value of the IPS in the total set containing the training, validation, and WHO grade III gliomas sets is shown in Supplementary Figure 2.
Establishment of an IPS-based nomogram model
The univariate Cox analysis revealed that the IPS was significantly associated with OS (Hazard ratio: 1.167, 95% confidence interval: 1.076−1.267, P < 0.001). The multivariate Cox analysis showed that the IPS could serve as an independent prognostic factor (Hazard ratio: 1.199, 95% confidence interval: 1.101−1.305, P < 0.001) (Figure 5A). Finally, we established an IPS-based nomogram model (Figure 5B). The C-index (0.674) showed the specific discrimination ability of the nomogram model. Calibration plots of observed vs. predicted probabilities of 1-, 2-, and 3-year OS demonstrated favorable concordance (Figure 5C).
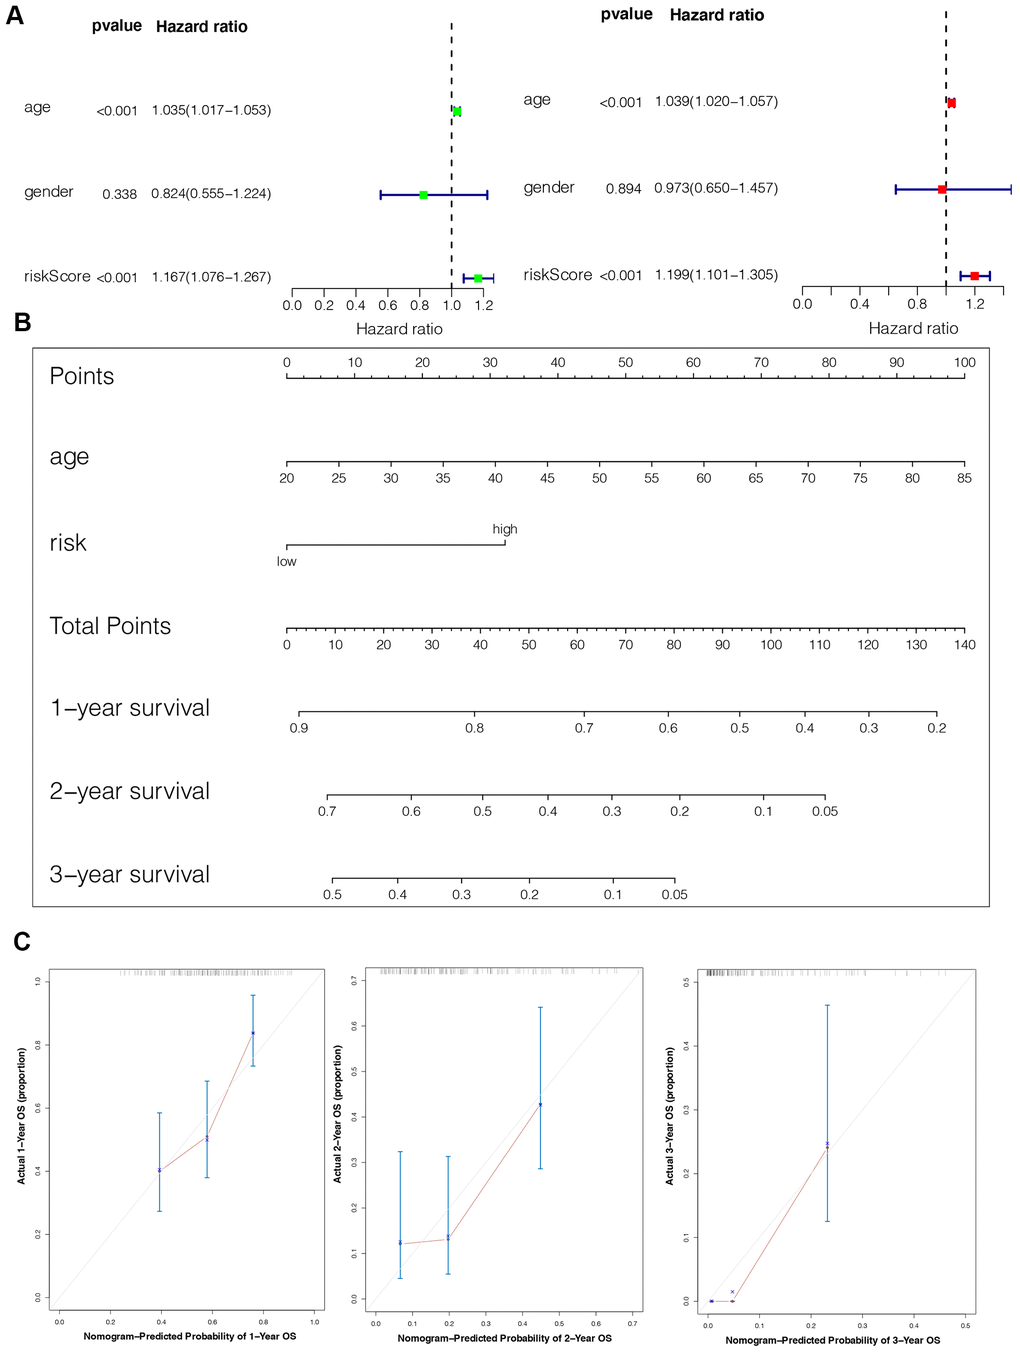
Figure 5. Construction of the nomogram model. (A) Univariate and multivariate Cox analyses indicating that the IPS is significantly associated with OS. (B) Nomogram model for predicting the probability of 1-, 2-, and 3-year OS in GBMs. (C) Calibration plots of the nomogram for predicting the probability of OS at 1, 2, and 3 years.
Discussion
Foxp3, a unique marker of natural regulatory T cells (nTregs) and adaptive/induced regulatory T cells (a/iTregs) [19], is a protein involved in immune system responses [20]. Foxp3+ Tregs are considered to constitute an essential part of the immunosuppressive microenvironment of gliomas [21]. However, the mechanism regulating the interaction of Foxp3 with the immune microenvironment is yet to be established.
Of all the GBMs, we found that mesenchymal glioblastomas have higher expression of Foxp3 than proneural and classical tumors (Supplementary Figure 3A). Kaffes et al. also demonstrated that mesenchymal glioblastomas are characterized by an increased immune cell presence [22]. No significant difference was observed between different IDH status in GBM (Supplementary Figure 3B).
In the present study, although we found that immune cells, functions, and pathways were enriched in Foxp3_H, the patients still had a worse prognosis. In contrast, He et al. found that triple-negative breast cancer patients with high immune status had a better prognosis [15]. In the analysis of HLA expression, we found that most HLA genes were expressed higher in Foxp3_H. Previous studies have shown that HLA expression was correlated with tumor grade and histological type [23]. Fan et al. found that glioma patients with low HLA-DR expression were more likely to benefit from immunotherapy [24]. Hence, immunotherapy might be more effective in patients of Foxp3_L.
The glioma immunosuppressive microenvironment might be responsible for these observations. We found that the expression of BTLA, CD27, ICOS, LAG-3, TIM-3, and IDO1 was higher in Foxp3_H (Figure 2E). This result suggested that, although immune activity was higher in Foxp3_H, immune cells were generally depleted and did not function optimally. Previous studies have also shown tumor-associated lymphocyte infiltration in glioblastoma with the lymphocyte generally having a poor function and severe exhaustion [25]. Therefore, immune checkpoint inhibitors could be a more effective treatment option for patients with high immune checkpoint gene expression.
To confirm the effect of Foxp3 in immune regulation, we compared Foxp3_H and Foxp3_L using differential expression analysis. A total of 294 genes were identified as the DEGs, including 91 differentially expressed immune genes among them. From the GO and KEGG analyses, the DEIGs were significantly enriched in complement activation, classical pathway, phagocytosis, recognition, T cell co-stimulation (GO terms), and cytokine-cytokine receptor interaction (KEGG). Furthermore, we developed and validated a Foxp3-related IPS which was related to prognosis. The four-gene IPS was also an independent prognostic factor by univariate and multivariate Cox analyses. Moreover, a predicting nomogram was developed based on the IPS to predict the survival of patients with GBM.
Four genes were identified as hub genes in our IPS by LASSO Cox regression: CXCL5, IGHV3-11, TNFSF14, and LGR6. CXCL5 (C-X-C motif chemokine ligand 5) encodes the protein CXCL5, a small cytokine belonging to the CXC chemokine family that is produced upon the stimulation of cells with the inflammatory cytokines IL-1 or TNF-α [26]. CXCL5 is not only known to regulate neutrophil homeostasis [27] but is also related to cancer cell migration/invasion and tumor angiogenesis [28]. In previous research, CXCL5 was shown to be up-regulated in glioma tissues compared with normal brain tissues and could promote the proliferation and migration of glioma cells by activating the ERK, JNK, p38, and MAPK signaling pathways [29]. In glioma cells, CD133, a cancer stem cell marker, raises the expression of IL-1β and its downstream chemokines, including CCL3, CXCL3, and CXCL5 [30]. Foxp3+Tregs could exert an immune function by controlling the CXCL5-IL-17 inflammatory axis [31]. And CXCL5 caused a 2.5-fold increase in the frequency of Foxp3+Tregs in CD4+T cells [32]. IGHV3-11 (immunoglobulin heavy variable 3-11) was one of the VH3 immunoglobulin gene family. The molecular function of IGHV3-11 is related to antigen binding and immunoglobulin receptor binding. Previous study had demonstrated that immunoglobulin could expand Foxp3+Tregs [33]. TNFSF14 (TNF superfamily member 14) encodes a member of the tumor necrosis factor (TNF) ligand family. This protein has been shown to induce the expansion of T cells and induce apoptosis of different tumor cells [34]. Treps et al. fused a CGKRK peptide with TNFSF14 and injected it intravenously into murine orthotopic GBM models. The tumor vasculature appeared to have normal features after treatment. Additionally, the authors observed more endothelial venules and T cell infiltration in solid tumors [35]. In a recent study, researchers determined that the expression of TNFSF14 negatively correlates with tumor mutation burden (TMB) in GBM and that TNFSF14 is a significant prognostic factor for poor OS [36]. TNFSF14 can promote the proliferation of Foxp3+Tregs [37], and bind HVEM which are expressed on Foxp3+Tregs to mediate the suppressive functions [38]. LGR6 (leucine-rich repeat containing G protein-coupled receptor 6) encodes a member of the leucine-rich repeat-containing subgroup of the G protein-coupled 7-transmembrane protein superfamily. LGR6 binds to RSPO ligands to activate the Wnt/β-catenin signaling pathway to promote cancer progression [39]. And Wnt/β-catenin signaling could modulate the TCF-1-dependent inhibition of Foxp3 transcriptional activity to limit immunosuppressive activity [40].
Interestingly, immune checkpoint genes, BTLA, CD27, ICOS, LAG-3, TIM-3, IDO1, and PD-L1 were expressed higher in the high-risk group (Supplementary Figure 4). This indicated that the high-risk patients identified by the Foxp3-related IPS might be having a better effect on immune checkpoint inhibitors.
For now, some predictive models of glioblastoma have been constructed. Tang et al. identified a model of a specific gene module. The AUC values were 0.61-0.67 and 0.71-0.88 for predicting 12-months and 36 months patient’s survival, respectively [41]. A relatively authentic immune-related predictive model constructed by Liang et al. had the AUC value of 0.869 [42]. In our present study, we found Foxp3 expression to be associated with prognosis and developed a Foxp3-related IPS with the AUC values for predicting 1- and 2-year patient survival of 0.633 and 0.695, respectively in the validation set. Our result provided a novel vision to study glioblastoma and we will verify the accuracy of the Foxp3-related IPS by our data in further research works.
Currently, the research on the microenvironment of gliomas attracting considerable attention from the scientific community. This study provided new insights into the GBM immune microenvironment from different perspectives. Nevertheless, there were some limitations. This study was retrospective hence there is a need for further prospective studies to confirm the value of our four genes functionally and mechanistically.
In summary, our study has identified the mechanism of Foxp3 expression on prognosis from the perspective of immunology. We have constructed a Foxp3-related IPS that can classify patients into different immune risk groups. Moreover, we have developed a nomogram to quantitatively predict a patient’s survival based on this IPS. These findings are beneficial for GBM patients for the development of individualized treatment plans and improvement of prognosis.
Materials and Methods
Data collection and immunohistochemical staining
The clinical and prognostic significance of Foxp3 expression was assessed in a prognosis cohort using immunohistochemical (IHC) staining of tissue microarray (TMA) slides. Formalin-fixed paraffin-embedded blocks of 72 specimens (49 WHO grade III gliomas and 23 WHO grade IV glioblastomas) were collected from the pathologic archive of the Sun Yat-sen University Cancer Center (SYSUCC) from 1st January 2003 to 1st June 2006. Clinicopathological and follow-up data were retrieved from the medical records. The staging and grading evaluation followed the World Health Organization (WHO) 2016 classification. All the procedures in the current study were approved by the ethics committee of Sun Yat-sen University Cancer Centre. Written informed consent was obtained from all the patients.
Immunohistochemical staining for Foxp3 (1:1000, ab10901) was conducted on 4-μm-thick TMA sections according to the manufacturer's instructions. Immunoreactivity in >0% of cells was defined as positive Foxp3 IHC staining. Two pathologists read the Foxp3 IHC slides.
Gene expression datasets and data processing
RNA-seq data from 152 GBM samples were obtained from the TCGA website (https://portal.gdc.cancer.gov/). The survival data were available for all the patients, and their survival time was at least 30 days. Patients were divided into two groups, 76 Foxp3_H patients and 76 Foxp3_L patients, based on their median Foxp3 expression value. The RNA transcriptome profiling was then performed using a log2-based transformation of FPKM values.
Immunogenomic analysis
Enrichment levels of the 29-immune signature in each GBM sample were quantified using the single-sample gene-set enrichment analysis (ssGSEA) score [16, 17]. This was followed by the evaluation of the immune cell infiltration level (immune score), stromal content (stromal score), and tumor purity for each GBM sample by Estimation of STromal and Immune cells in MAlignant Tumours using Expression data (ESTIMATE) [43]. Expression levels of human leukocyte antigen (HLA) genes and immune checkpoint genes were then compared between Foxp3_H and Foxp3_L using analysis of variance (ANOVA) test.
Survival analysis
The OS of GBM patients was compared between Foxp3_H and Foxp3_L. The log-rank test was used to calculate the significance of survival time differences using a threshold of P < 0.05. Kaplan–Meier curves were plotted to show the survival time differences.
Differential expression analysis
Differential expression analysis between Foxp3_H and Foxp3_L was processed and executed onRstudio using the Wilcoxon Rank Sum and Signed Rank Tests [44]. Genes with log2 |fold change| ≥1 and False Discovery Rate (FDR) <0.05 were selected as differentially expressed genes (DEGs). DEIGs were identified by the ImmPort database (https://www.immport.org/) [18].
Functional enrichment analysis
To analyze gene ontology and signaling pathway enrichment, DEIGs were uploaded to an online tool, Metascape, a website for gene annotation, visualization, and attributes (https://metascape.org/) [45–48].
Construction and validation of the immune prognostic signature (IPS)
For the construction of the immune prognostic signature (IPS), the TCGA GBM dataset was randomly divided into two sets: training and validation. DEIGs in the training set were placed into LASSO Cox regression for analysis using the “glmnet” R package to establish IPSs [49–51]. An IPS was created by weighting the Cox regression coefficients to estimate a risk score for each patient. Patients were categorized as low-risk or high-risk according to the optimal cut-off values acquired by the “survminer” R package. Receiver operating characteristic (ROC) curves were generated to evaluate the sensitivity and specificity of IPS using the “survivalROC” R package [52]. The area under the curve values were calculated for the ROC curves. Subsequently, the prognostic prediction power of this IPS was further validated using the validation set.
Development of the nomogram
The univariate and multivariate Cox analyses were used to evaluate the independent prognostic ability of the IPS. The “rms” package was used to develop an innovative nomogram based on the results of the Cox analyses. Calibration plots of observed vs. predicted probabilities of 1-, 2-, and 3-year OS were generated to determine the accuracy. The discrimination of the model was determined using the concordance index (C-index). Bootstraps were calculated to correct the C-index [53].
Author Contributions
XY Guo and GH Zhang participated in the design of the study, performed the statistical analysis and interpretation of data, and drafted the manuscript. ZN Wang collected and organized the data. H Duan and T Xie carried out the immunohistochemistry. L Liang, R Cui and HR Hu participated in the design of study and performed the statistical analysis. Y Wu and JJ Dong provided help in the revisions of the manuscript. ZQ He and YG Mou conceived of the study, revised and approved the final manuscript. All authors read and approved the final manuscript.
Acknowledgments
We thank J. Iacona, Ph.D., from Liwen Bianji, Edanz Editing China (https://www.liwenbianji.cn/ac), for editing the English text of a draft of this manuscript.
Conflicts of Interest
The authors have no conflicts of interest to declare.
Funding
This work was supported by Science and Technology Planning Project of Guangdong Province, China (grant number 2015B010125003), Science and Technology Program of Guangzhou, China (grant number 201704020133), Science and Technology Program of Jiangmen, China (grant number 2018630100110019805), National Natural Science Foundation of China (grant number 81872324), Medical Scientific Research Foundation of Guangdong Province of China (A2020149), Fundamental Research Funds for Junior Teachers in Sun Yat-sen University, China (20ykpy163), Science and Technology Achievement Translation Project in Sun Yat-sen University (84000-18843234). The funders had no role in study design, data collection and analysis, decision to publish, or preparation of the manuscript.
References
- 1. Rock K, McArdle O, Forde P, Dunne M, Fitzpatrick D, O’Neill B, Faul C. A clinical review of treatment outcomes in glioblastoma multiforme—the validation in a non-trial population of the results of a randomised phase III clinical trial: has a more radical approach improved survival? Br J Radiol. 2012; 85:e729–33. https://doi.org/10.1259/bjr/83796755 [PubMed]
- 2. Cuddapah VA, Robel S, Watkins S, Sontheimer H. A neurocentric perspective on glioma invasion. Nat Rev Neurosci. 2014; 15:455–65. https://doi.org/10.1038/nrn3765 [PubMed]
- 3. Stupp R, Mason WP, van den Bent MJ, Weller M, Fisher B, Taphoorn MJ, Belanger K, Brandes AA, Marosi C, Bogdahn U, Curschmann J, Janzer RC, Ludwin SK, et al, and European Organisation for Research and Treatment of Cancer Brain Tumor and Radiotherapy Groups, and National Cancer Institute of Canada Clinical Trials Group. Radiotherapy plus concomitant and adjuvant temozolomide for glioblastoma. N Engl J Med. 2005; 352:987–96. https://doi.org/10.1056/NEJMoa043330 [PubMed]
- 4. Weller M, Wick W, Aldape K, Brada M, Berger M, Pfister SM, Nishikawa R, Rosenthal M, Wen PY, Stupp R, Reifenberger G. Glioma. Nat Rev Dis Primers. 2015; 1:15017. https://doi.org/10.1038/nrdp.2015.17 [PubMed]
- 5. Doroshow DB, Sanmamed MF, Hastings K, Politi K, Rimm DL, Chen L, Melero I, Schalper KA, Herbst RS. Immunotherapy in non-small cell lung cancer: facts and hopes. Clin Cancer Res. 2019; 25:4592–602. https://doi.org/10.1158/1078-0432.CCR-18-1538 [PubMed]
- 6. Tumeh PC, Harview CL, Yearley JH, Shintaku IP, Taylor EJ, Robert L, Chmielowski B, Spasic M, Henry G, Ciobanu V, West AN, Carmona M, Kivork C, et al. PD-1 blockade induces responses by inhibiting adaptive immune resistance. Nature. 2014; 515:568–71. https://doi.org/10.1038/nature13954 [PubMed]
- 7. Louveau A, Smirnov I, Keyes TJ, Eccles JD, Rouhani SJ, Peske JD, Derecki NC, Castle D, Mandell JW, Lee KS, Harris TH, Kipnis J. Corrigendum: structural and functional features of central nervous system lymphatic vessels. Nature. 2016; 533:278. https://doi.org/10.1038/nature16999 [PubMed]
- 8. Frei K, Gramatzki D, Tritschler I, Schroeder JJ, Espinoza L, Rushing EJ, Weller M. Transforming growth factor-β pathway activity in glioblastoma. Oncotarget. 2015; 6:5963–77. https://doi.org/10.18632/oncotarget.3467 [PubMed]
- 9. Alterman RL, Stanley ER. Colony stimulating factor-1 expression in human glioma. Mol Chem Neuropathol. 1994; 21:177–88. https://doi.org/10.1007/BF02815350 [PubMed]
- 10. Miller J, Eisele G, Tabatabai G, Aulwurm S, von Kürthy G, Stitz L, Roth P, Weller M. Soluble CD70: a novel immunotherapeutic agent for experimental glioblastoma. J Neurosurg. 2010; 113:280–85. https://doi.org/10.3171/2009.11.JNS09901 [PubMed]
- 11. Parsa AT, Waldron JS, Panner A, Crane CA, Parney IF, Barry JJ, Cachola KE, Murray JC, Tihan T, Jensen MC, Mischel PS, Stokoe D, Pieper RO. Loss of tumor suppressor PTEN function increases B7-H1 expression and immunoresistance in glioma. Nat Med. 2007; 13:84–88. https://doi.org/10.1038/nm1517 [PubMed]
- 12. Wing K, Onishi Y, Prieto-Martin P, Yamaguchi T, Miyara M, Fehervari Z, Nomura T, Sakaguchi S. CTLA-4 control over Foxp3+ regulatory T cell function. Science. 2008; 322:271–75. https://doi.org/10.1126/science.1160062 [PubMed]
- 13. Brusko TM, Wasserfall CH, Agarwal A, Kapturczak MH, Atkinson MA. An integral role for heme oxygenase-1 and carbon monoxide in maintaining peripheral tolerance by CD4+CD25+ regulatory T cells. J Immunol. 2005; 174:5181–86. https://doi.org/10.4049/jimmunol.174.9.5181 [PubMed]
- 14. Ooi YC, Tran P, Ung N, Thill K, Trang A, Fong BM, Nagasawa DT, Lim M, Yang I. The role of regulatory T-cells in glioma immunology. Clin Neurol Neurosurg. 2014; 119:125–32. https://doi.org/10.1016/j.clineuro.2013.12.004 [PubMed]
- 15. He Y, Jiang Z, Chen C, Wang X. Classification of triple-negative breast cancers based on immunogenomic profiling. J Exp Clin Cancer Res. 2018; 37:327. https://doi.org/10.1186/s13046-018-1002-1 [PubMed]
- 16. Barbie DA, Tamayo P, Boehm JS, Kim SY, Moody SE, Dunn IF, Schinzel AC, Sandy P, Meylan E, Scholl C, Fröhling S, Chan EM, Sos ML, et al. Systematic RNA interference reveals that oncogenic KRAS-driven cancers require TBK1. Nature. 2009; 462:108–12. https://doi.org/10.1038/nature08460 [PubMed]
- 17. Hänzelmann S, Castelo R, Guinney J. GSVA: gene set variation analysis for microarray and RNA-seq data. BMC Bioinformatics. 2013; 14:7. https://doi.org/10.1186/1471-2105-14-7 [PubMed]
- 18. Fan X, Liang J, Wu Z, Shan X, Qiao H, Jiang T. Expression of HLA-DR genes in gliomas: correlation with clinicopathological features and prognosis. Chinese Neurosurgical Journal. 2017; 27:3. https://doi.org/10.1186/s41016-017-0090-7
- 19. Bhattacharya S, Dunn P, Thomas CG, Smith B, Schaefer H, Chen J, Hu Z, Zalocusky KA, Shankar RD, Shen-Orr SS, Thomson E, Wiser J, Butte AJ. ImmPort, toward repurposing of open access immunological assay data for translational and clinical research. Sci Data. 2018; 5:180015. https://doi.org/10.1038/sdata.2018.15 [PubMed]
- 20. Hori S, Nomura T, Sakaguchi S. Control of regulatory T cell development by the transcription factor Foxp3. Science. 2003; 299:1057–61. https://doi.org/10.1126/science.1079490 [PubMed]
- 21. Brunkow ME, Jeffery EW, Hjerrild KA, Paeper B, Clark LB, Yasayko SA, Wilkinson JE, Galas D, Ziegler SF, Ramsdell F. Disruption of a new forkhead/winged-helix protein, scurfin, results in the fatal lymphoproliferative disorder of the scurfy mouse. Nat Genet. 2001; 27:68–73. https://doi.org/10.1038/83784 [PubMed]
- 22. El Andaloussi A, Lesniak MS. An increase in CD4+CD25+FOXP3+ regulatory T cells in tumor-infiltrating lymphocytes of human glioblastoma multiforme. Neuro Oncol. 2006; 8:234–43. https://doi.org/10.1215/15228517-2006-006 [PubMed]
- 23. Kaffes I, Szulzewsky F, Chen Z, Herting CJ, Gabanic B, Velázquez Vega JE, Shelton J, Switchenko JM, Ross JL, McSwain LF, Huse JT, Westermark B, Nelander S, et al. Human mesenchymal glioblastomas are characterized by an increased immune cell presence compared to proneural and classical tumors. Oncoimmunology. 2019; 8:e1655360. https://doi.org/10.1080/2162402X.2019.1655360 [PubMed]
- 24. Wu Z, Liang J, Wang Z, Li A, Fan X, Jiang T. HLA-E expression in diffuse glioma: relationship with clinicopathological features and patient survival. BMC Neurol. 2020; 20:59. https://doi.org/10.1186/s12883-020-01640-4 [PubMed]
- 25. Woroniecka K, Chongsathidkiet P, Rhodin K, Kemeny H, Dechant C, Farber SH, Elsamadicy AA, Cui X, Koyama S, Jackson C, Hansen LJ, Johanns TM, Sanchez-Perez L, et al. T-cell exhaustion signatures vary with tumor type and are severe in glioblastoma. Clin Cancer Res. 2018; 24:4175–86. https://doi.org/10.1158/1078-0432.CCR-17-1846 [PubMed]
- 26. Chang MS, McNinch J, Basu R, Simonet S. Cloning and characterization of the human neutrophil-activating peptide (ENA-78) gene. J Biol Chem. 1994; 269:25277–82. [PubMed]
- 27. Mei J, Liu Y, Dai N, Hoffmann C, Hudock KM, Zhang P, Guttentag SH, Kolls JK, Oliver PM, Bushman FD, Worthen GS. Cxcr2 and Cxcl5 regulate the IL-17/G-CSF axis and neutrophil homeostasis in mice. J Clin Invest. 2012; 122:974–86. https://doi.org/10.1172/JCI60588 [PubMed]
- 28. Ando Y, Ohuchida K, Otsubo Y, Kibe S, Takesue S, Abe T, Iwamoto C, Shindo K, Moriyama T, Nakata K, Miyasaka Y, Ohtsuka T, Oda Y, Nakamura M. Necroptosis in pancreatic cancer promotes cancer cell migration and invasion by release of CXCL5. PLoS One. 2020; 15:e0228015. https://doi.org/10.1371/journal.pone.0228015 [PubMed]
- 29. Dai Z, Wu J, Chen F, Cheng Q, Zhang M, Wang Y, Guo Y, Song T. CXCL5 promotes the proliferation and migration of glioma cells in autocrine- and paracrine-dependent manners. Oncol Rep. 2016; 36:3303–10. https://doi.org/10.3892/or.2016.5155 [PubMed]
- 30. Lee SY, Kim JK, Jeon HY, Ham SW, Kim H. CD133 regulates IL-1β signaling and neutrophil recruitment in glioblastoma. Mol Cells. 2017; 40:515–22. https://doi.org/10.14348/molcells.2017.0089 [PubMed]
- 31. Mathur AN, Zirak B, Boothby IC, Tan M, Cohen JN, Mauro TM, Mehta P, Lowe MM, Abbas AK, Ali N, Rosenblum MD. Treg-cell control of a CXCL5-IL-17 inflammatory axis promotes hair-follicle-stem-cell differentiation during skin-barrier repair. Immunity. 2019; 50:655–67.e4. https://doi.org/10.1016/j.immuni.2019.02.013 [PubMed]
- 32. Shi G, Han J, Liu G, Hao Y, Ma Y, Li T, Wu X, Zhang H, Liu Y, Wang B, Kong Y, Zhou J, Zeng H. Expansion of activated regulatory T cells by myeloid-specific chemokines via an alternative pathway in CSF of bacterial meningitis patients. Eur J Immunol. 2014; 44:420–30. https://doi.org/10.1002/eji.201343572 [PubMed]
- 33. Bayry J, Mouthon L, Kaveri SV. Intravenous immunoglobulin expands regulatory T cells in autoimmune rheumatic disease. J Rheumatol. 2012; 39:450–51. https://doi.org/10.3899/jrheum.111123 [PubMed]
- 34. Rooney IA, Butrovich KD, Glass AA, Borboroglu S, Benedict CA, Whitbeck JC, Cohen GH, Eisenberg RJ, Ware CF. The lymphotoxin-beta receptor is necessary and sufficient for LIGHT-mediated apoptosis of tumor cells. J Biol Chem. 2000; 275:14307–15. https://doi.org/10.1074/jbc.275.19.14307 [PubMed]
- 35. Treps L. EnLIGHTenment of tumor vessel normalization and immunotherapy in glioblastoma. J Pathol. 2018; 246:3–6. https://doi.org/10.1002/path.5103 [PubMed]
- 36. Long S, Li M, Liu J, Yang Y, Li G. Identification of immunologic subtype and prognosis of GBM based on TNFSF14 and immune checkpoint gene expression profiling. Aging (Albany NY). 2020; 12:7112–28. https://doi.org/10.18632/aging.103065 [PubMed]
- 37. Wang Y, Zhu M, Yu P, Fu YX. Promoting immune responses by LIGHT in the face of abundant regulatory T cell inhibition. J Immunol. 2010; 184:1589–95. https://doi.org/10.4049/jimmunol.0901582 [PubMed]
- 38. Tao R, Wang L, Murphy KM, Fraser CC, Hancock WW. Regulatory T cell expression of herpesvirus entry mediator suppresses the function of B and T lymphocyte attenuator-positive effector T cells. J Immunol. 2008; 180:6649–55. https://doi.org/10.4049/jimmunol.180.10.6649 [PubMed]
- 39. Chai T, Shen Z, Zhang Z, Chen S, Gao L, Zhang P, Lin W, Kang M, Lin J. LGR6 is a potential diagnostic and prognostic marker for esophageal squamous cell carcinoma. J Clin Lab Anal. 2020; 34:e23121. https://doi.org/10.1002/jcla.23121 [PubMed]
- 40. van Loosdregt J, Fleskens V, Tiemessen MM, Mokry M, van Boxtel R, Meerding J, Pals CE, Kurek D, Baert MR, Delemarre EM, Gröne A, Koerkamp MJ, Sijts AJ, et al. Canonical Wnt signaling negatively modulates regulatory T cell function. Immunity. 2013; 39:298–310. https://doi.org/10.1016/j.immuni.2013.07.019 [PubMed]
- 41. Tang X, Xu P, Wang B, Luo J, Fu R, Huang K, Dai L, Lu J, Cao G, Peng H, Zhang L, Zhang Z, Chen Q. Identification of a specific gene module for predicting prognosis in glioblastoma patients. Front Oncol. 2019; 9:812. https://doi.org/10.3389/fonc.2019.00812 [PubMed]
- 42. Liang P, Chai Y, Zhao H, Wang G. Predictive analyses of prognostic-related immune genes and immune infiltrates for glioblastoma. Diagnostics (Basel). 2020; 10:177. https://doi.org/10.3390/diagnostics10030177 [PubMed]
- 43. Yoshihara K, Shahmoradgoli M, Martínez E, Vegesna R, Kim H, Torres-Garcia W, Treviño V, Shen H, Laird PW, Levine DA, Carter SL, Getz G, Stemke-Hale K, et al. Inferring tumour purity and stromal and immune cell admixture from expression data. Nat Commun. 2013; 4:2612. https://doi.org/10.1038/ncomms3612 [PubMed]
- 44. Servant N, Gravier E, Gestraud P, Laurent C, Paccard C, Biton A, Brito I, Mandel J, Asselain B, Barillot E, Hupé P. EMA - A R package for easy microarray data analysis. BMC Res Notes. 2010; 3:277. https://doi.org/10.1186/1756-0500-3-277 [PubMed]
- 45. Ashburner M, Ball CA, Blake JA, Botstein D, Butler H, Cherry JM, Davis AP, Dolinski K, Dwight SS, Eppig JT, Harris MA, Hill DP, Issel-Tarver L, et al. Gene ontology: tool for the unification of biology. The gene ontology consortium. Nat Genet. 2000; 25:25–29. https://doi.org/10.1038/75556 [PubMed]
- 46. Gene Ontology Consortium. Gene ontology consortium: going forward. Nucleic Acids Res. 2015; 43:D1049–56. https://doi.org/10.1093/nar/gku1179 [PubMed]
- 47. Lebrec JJ, Huizinga TW, Toes RE, Houwing-Duistermaat JJ, van Houwelingen HC. Integration of gene ontology pathways with North American rheumatoid arthritis consortium genome-wide association data via linear modeling. BMC Proc. 2009 (Suppl 7); 3:S94. https://doi.org/10.1186/1753-6561-3-s7-s94 [PubMed]
- 48. Zhou Y, Zhou B, Pache L, Chang M, Khodabakhshi AH, Tanaseichuk O, Benner C, Chanda SK. Metascape provides a biologist-oriented resource for the analysis of systems-level datasets. Nat Commun. 2019; 10:1523. https://doi.org/10.1038/s41467-019-09234-6 [PubMed]
- 49. Tibshirani R. The lasso method for variable selection in the cox model. Stat Med. 1997; 16:385–95. https://doi.org/10.1002/(sici)1097-0258(19970228)16:4<385::aid-sim380>3.0.co;2-3 [PubMed]
- 50. Friedman J, Hastie T, Tibshirani R. Regularization paths for generalized linear models via coordinate descent. J Stat Softw. 2010; 33:1–22. [PubMed]
- 51. Goeman JJ. L1 penalized estimation in the cox proportional hazards model. Biom J. 2010; 52:70–84. https://doi.org/10.1002/bimj.200900028 [PubMed]
- 52. Heagerty PJ, Lumley T, Pepe MS. Time-dependent ROC curves for censored survival data and a diagnostic marker. Biometrics. 2000; 56:337–44. https://doi.org/10.1111/j.0006-341x.2000.00337.x [PubMed]
- 53. Kiran M, Chatrath A, Tang X, Keenan DM, Dutta A. A prognostic signature for lower grade gliomas based on expression of long non-coding RNAs. Mol Neurobiol. 2019; 56:4786–98. https://doi.org/10.1007/s12035-018-1416-y [PubMed]