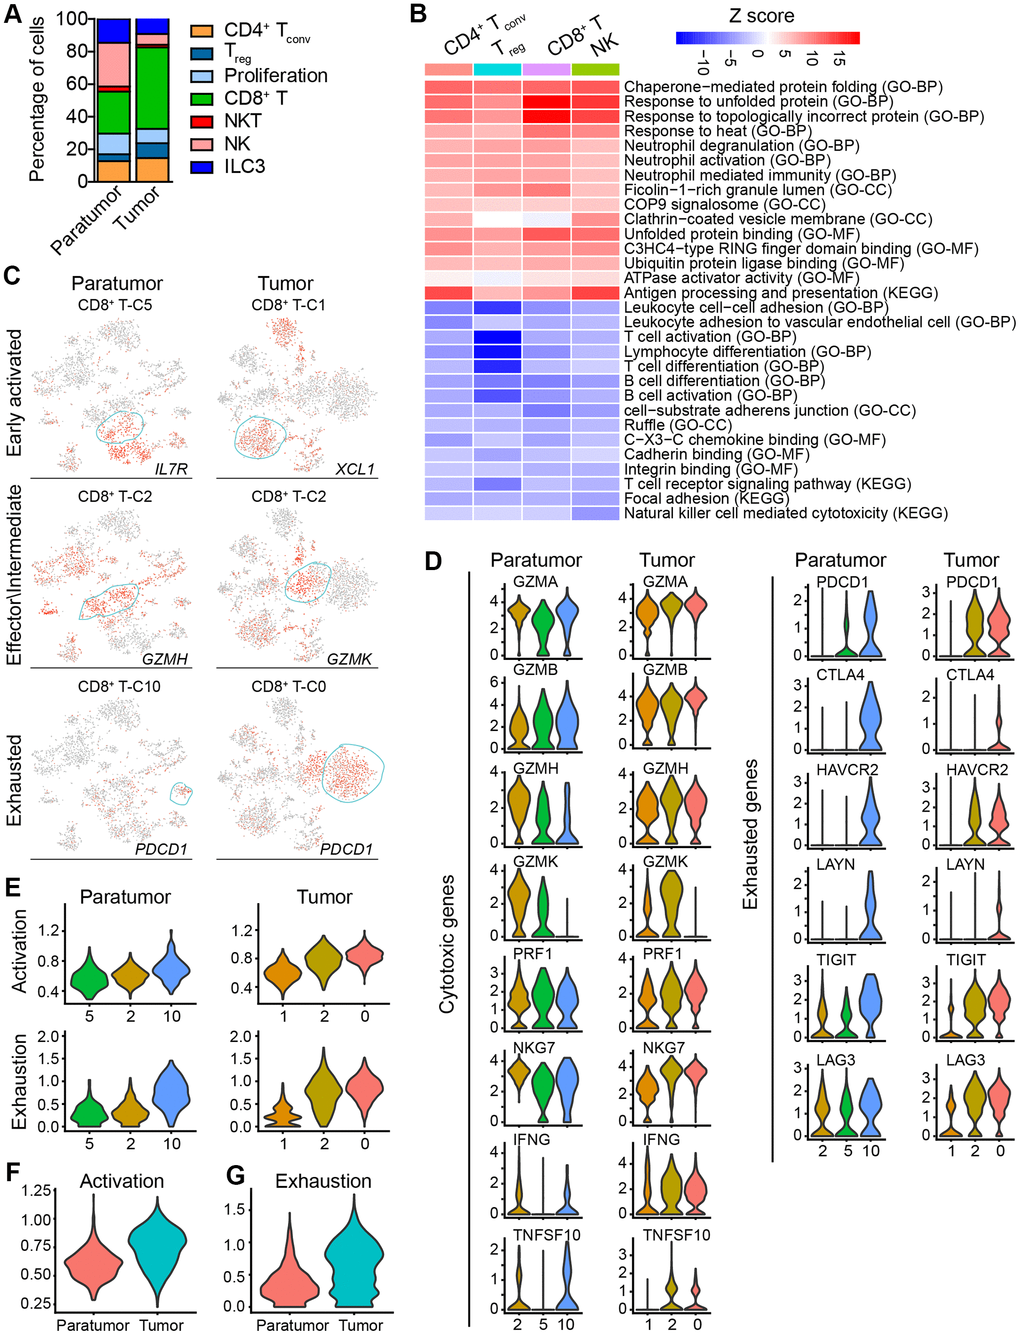
Figure 6.Subtype marker genes expressed in lymphoid cells and functional genes expressed in CD8+ T cells. (A) The fractions of lymphoid subtypes in Paratumor and Tumor. (B) Enriched pathway activities for up- (red) and down- (blue) regulated genes, between T cells from Tumor versus Paratumor. Color key from white to red indicates z-score of -Log10(P value), color key from white to blue indicates z-score of Log10(P value). (C) t-SNE plot, color-coded to show the relative expression (gray to red) of marker genes for the 3 states of indicated CD8+ T cells. (D) Violin plots displaying the expression profile of cytotoxic and exhausted genes of the CD8+ T cell clusters in Paratumor (left panel) and Tumor (right panel). (E) Violin plots indicating relative expression levels of T cell activation and exhaustion gene signatures across the CD8+ T cell clusters in Paratumor (left panel) and Tumor (right panel). (F, G) Violin plots indicating relative expression levels of T cell activation (F) and exhaustion (G) gene signatures in different tissue types.