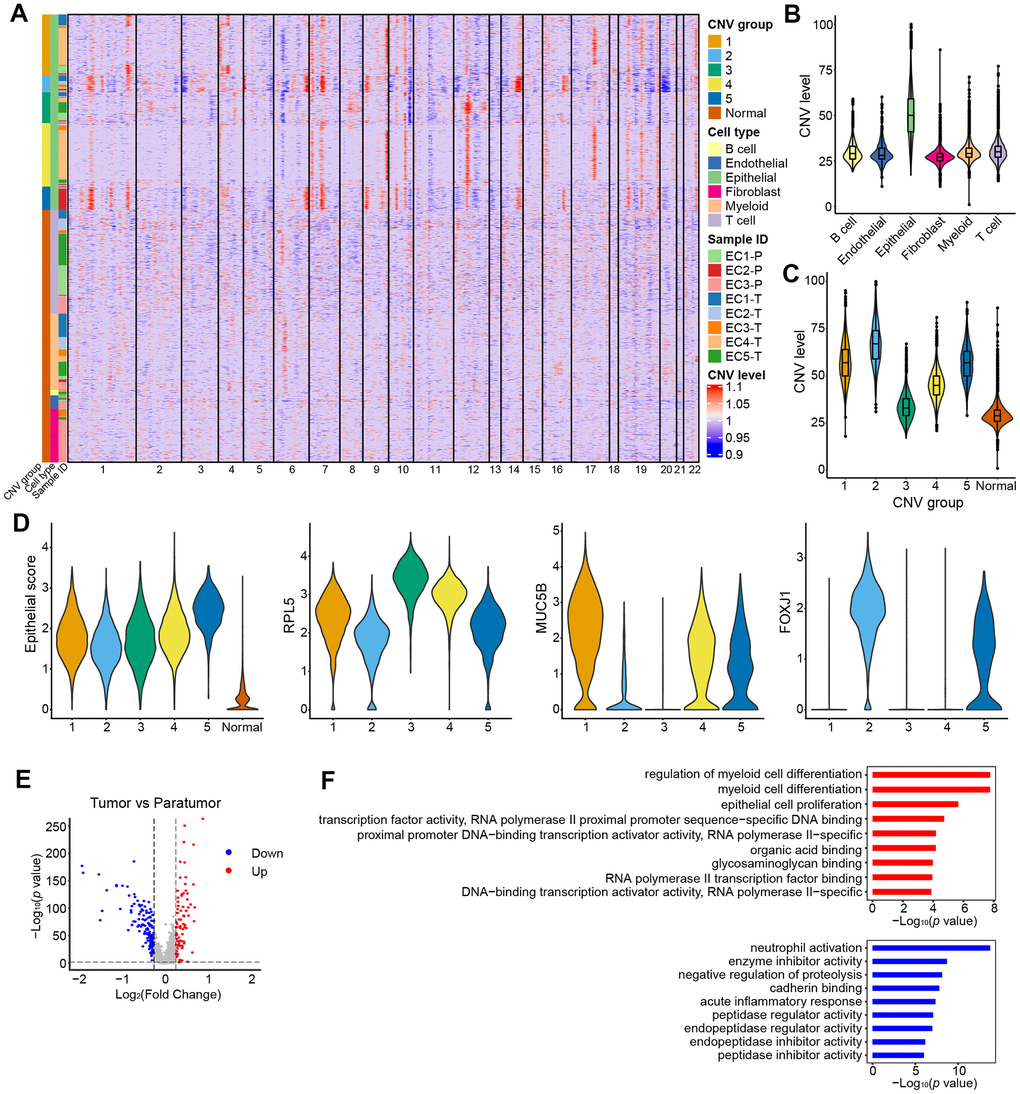
Figure 7.CNV landscape of epithelial cells. (A) Heatmap showing large-scale CNVs for individual cells (rows) of eight samples from five patients. (B) Violin plots showing distributions of CNV scores among different cell types. (C) Violin plots showing distributions of CNV scores among different CNV groups. (D) Violin plots showing expression of epithelial subtype-related genes among different CNV groups. (E) Differential expressed genes detected between tumor samples vs. their paratumor counterparts from EC1-3. (F) Representative enriched GO terms for up- (red) and down- (blue) regulated genes as displayed in E, respectively.