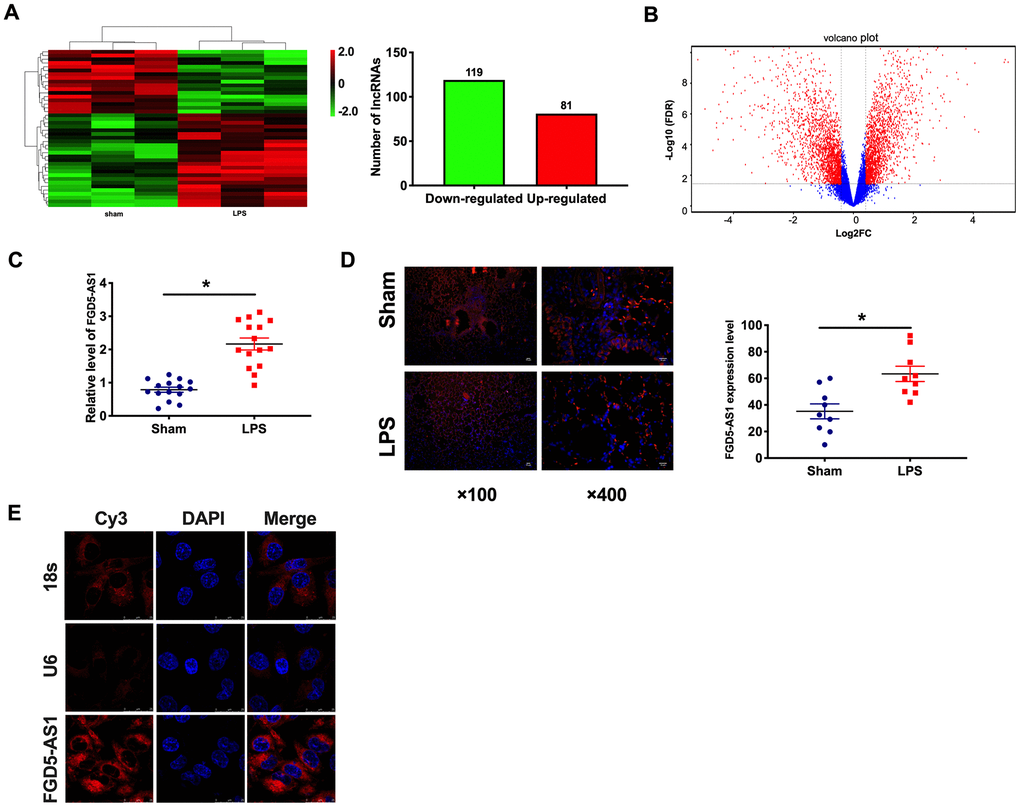
Figure 1.The upregulated of FGD5-AS1 in acute pneumonia. (A) Heat map of lncRNA profile comparison between LPS group and normal lung samples. n=3. (B) A cluster heat map was used to show the expression variations of these lncRNA transcripts in the LPS group and normal lung samples. (C) The expression of FGD5-AS1 in the LPS group and normal lung samples. n=15. (D) FISH analysis of the localization and expression levels of FGD5-AS1 in lung tissues. n=9. (E) The FISH assay was performed to explore the location of FGD5-AS1. *P < 0.05.