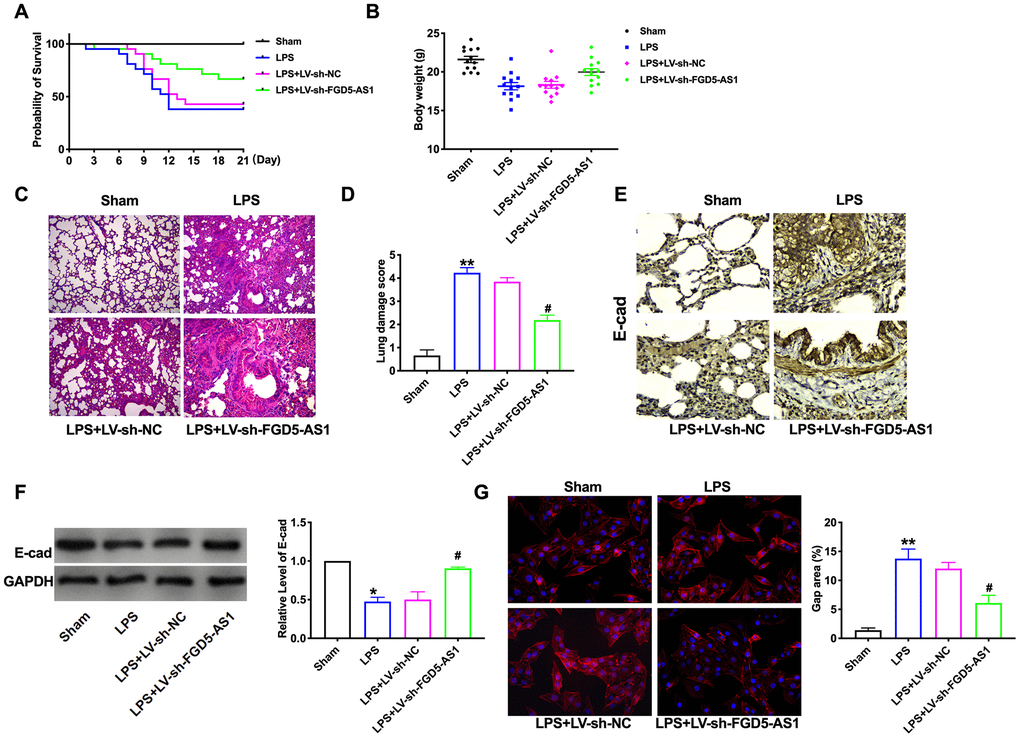
Figure 2.Knockdown of FGD5-AS1 alleviates LPS-induced mouse lung injury. (A) The survival curves of mice in different groups. n=13. (B) The body weight of mice in different groups. n=13. (C) H&E analysis of the morphological changes for lung tissue. (D) The lung damage score of mice in different groups. n=6. (E) Immunohistochemistry analysis of the expression levels of E-cad in lung tissue. (F) The protein level of E-cad in lung tissue. n=6. (G) Immunofluorescence assay of F-Actin in lung tissue. n=4. *P < 0.05, #P<0.05.