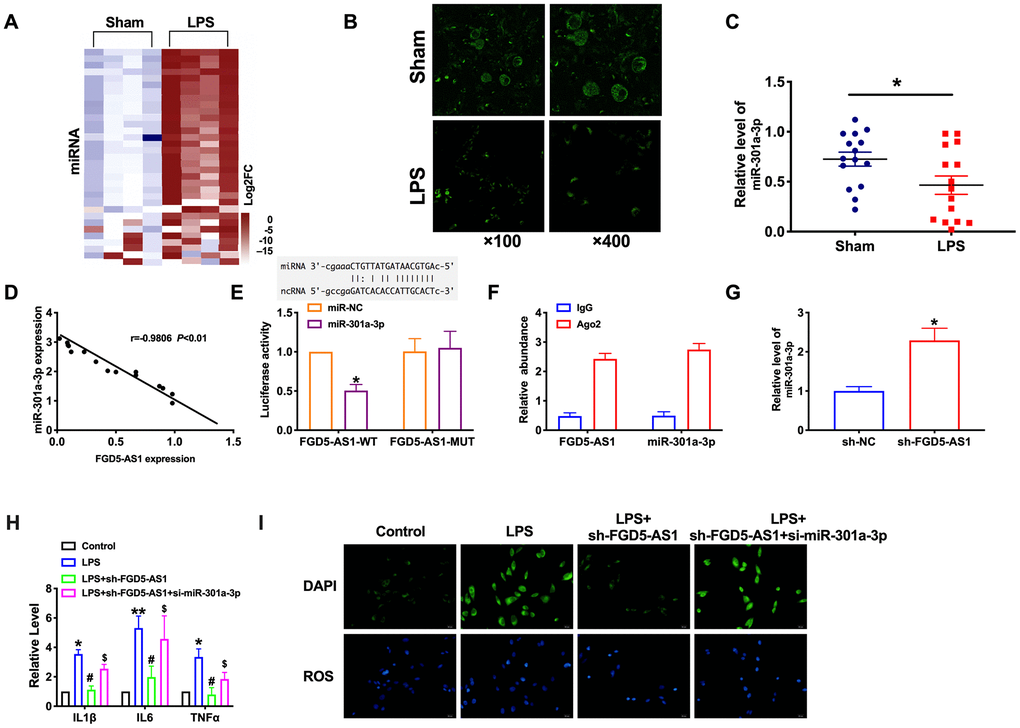
Figure 6.FGD5-AS1 acts as a sponge of miR-301a-3p. (A) Heat map of miRNA profile comparison between LPS group and normal lung samples. (B–D) FISH analysis of the localization and expression levels of miR-301a-3p and validation of the correlation of FGD5-AS1 with miR-301a-3p expression in lung tissues. n=15. (E) Luciferase activity of WT or Mut FGD5-AS1 after the co-transfection with the miR-301a-3p mimic. n=4, (F) RIP analysis of the amount of FGD5-AS1 and miR-301a-3p pulled down from the Ago2 protein. n=4. (G) The expression level of miR-301a-3p was measured. n=6. (H) The level of cytokines was assessed by ELISA. n=4. (I) The production of ROS in TC-1 cells. *P < 0.05, **P < 0.01, #P < 0.05, $P<0.05.