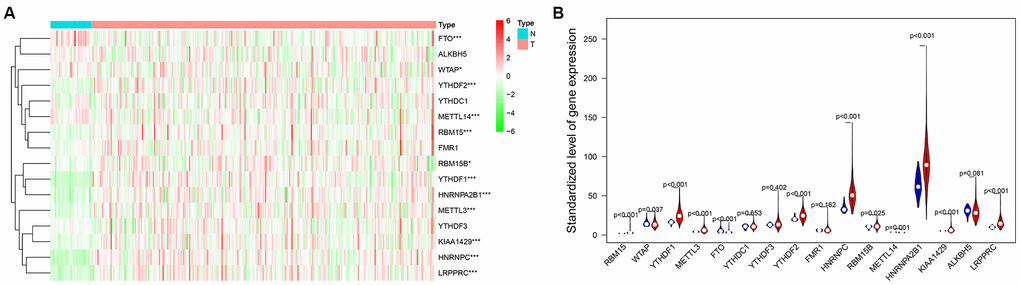
Figure 1.(A) The heat map of differential expression of M6A-related genes in normal samples and female lung adenocarcinoma samples. The color from green to red shows a trend from low expression to high expression. (B) The violin diagram of differential expression of M6A-related genes in normal samples and female lung adenocarcinoma samples. The Y axis is the standardized level of gene expression. Red represents high expression, blue represents low expression. P<0.05 as the statistical cutoff value.