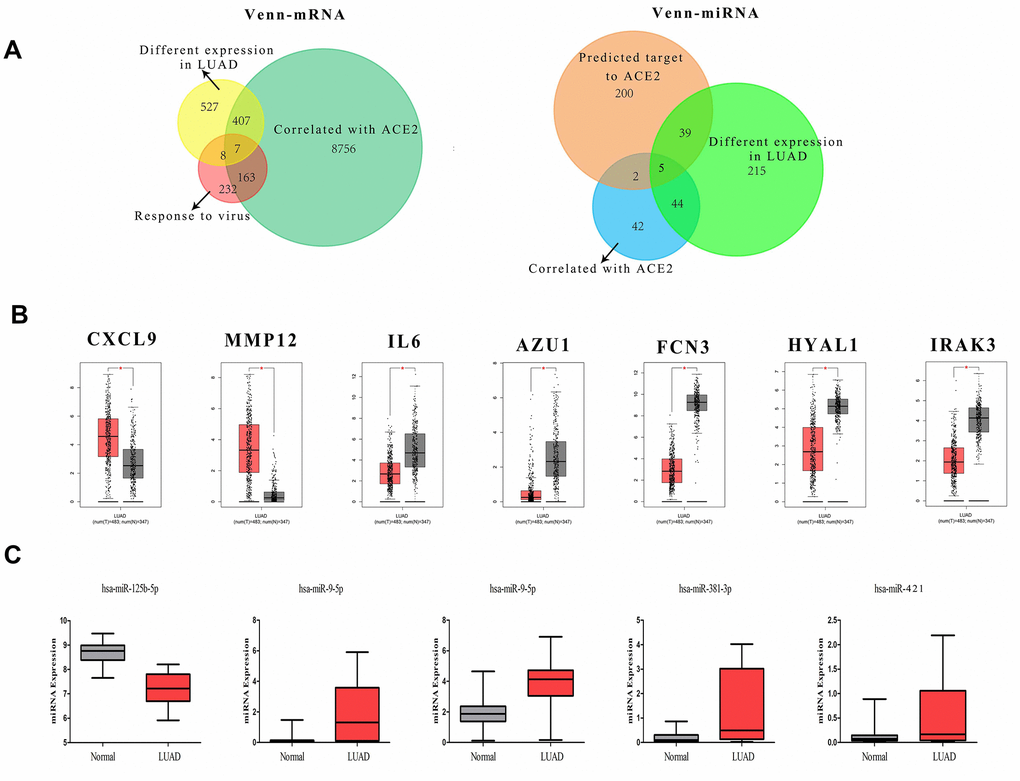
Figure 2.The definition of DECGs and DECMs. (A) Two Venn-plots showed the sifting process of DECGs (left) and DECMs (right). The yellow circle represents the differentially expressed mRNA in LUAD. The green circle represents the genes correlated with ACE2 in LUAD. The carnation circle represents the gene set involved in virus defense. The orange circle represents the miRNAs which could bind to 3’-UTR of ACE2. The aqua circle represents the differentially expressed miRNAs in LUAD. The blue circle represents the miRNAs correlated with ACE2 in LUAD. (B, C) The box-plots showed the comparison of DECGs or DECMs level in normal tissues vs. LUAD tissues. The red samples represent tissues from LUAD patients and the gray ones represent tissues from healthy persons.