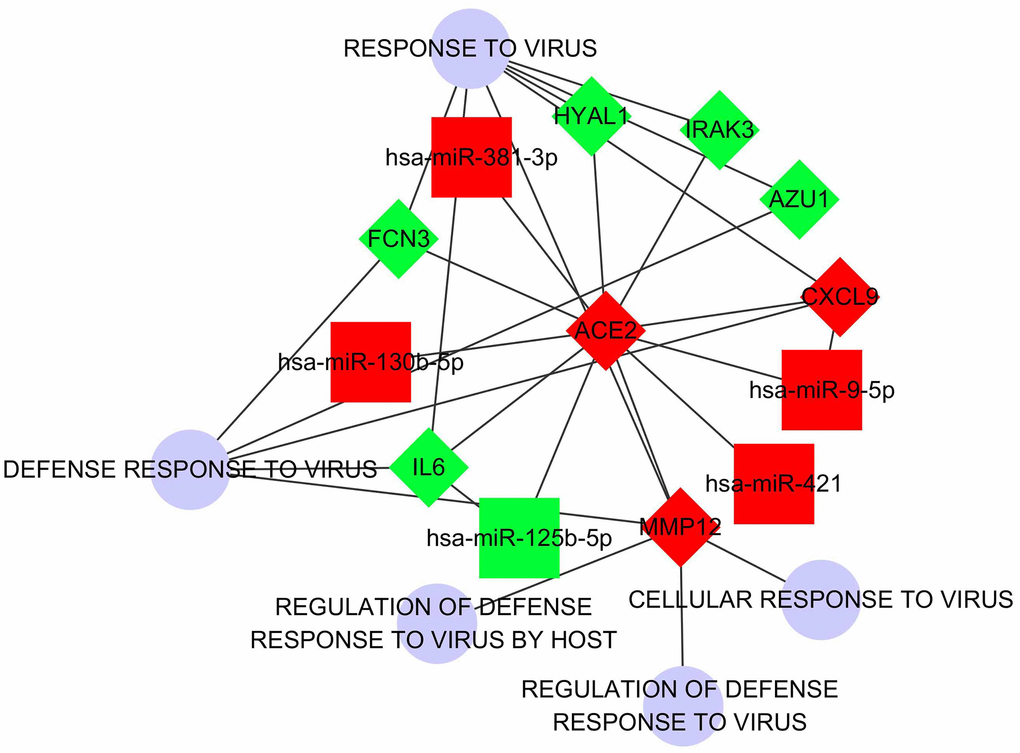
Figure 4.The regulatory network which regards ACE2 as the center. The squares represent DECMs. The rhombus represents DECGs. The blue circles represent biological processes correlated with virus defense. The red nodes represent the up-regulation of DECGs or DECMs. The green nodes represent down-regulation of DECGs or DECMs. The edges between every 2 nodes represent subordination or interactive relationship.